
REV date: 27-Aug-2018 11:21:09
MOBY264 data check
The intial check of the MOBY264 data before the satellite weighted data is put in the gold dir. There are two primary graphs below. The first data set plotted remove the earthsun distance, cosine response error (Ken) and solar zenith angle (using Ken cor#2 V04). Because we have adjusted the data for the solar zenith angle it is no longer neccisary to plot each hour separatly. So all the hour data are on one graph for each sensor and band. The second set of graphs just plot the data Lu or Es with no correction. So there are hour files. But if they time the hour files are collected change then the data will not match up very well with the mean and std data.
Most current plots using Ken Cor#2 V04 from the trends webpage. For these graphs the hour files are not separated because we have accounted for the zenith angle and other factors. This also means all the hour files are used for the mean and std giving a better estimate. The legend have the good, bad and questionable files from the current deployment as colored circles. The cyan are the last 4-6 deployments so you can see data points for current data. Note the 412 nm data for newer deployments will be high compared to the mean and std because the older deployments using a different stray light correction which makes the UV lower. Since the average uses all deployments whic will make the UV data look low compared to the mean.
| lu lw1 |
| lu lw7 |
| lu lw2 |
| es lw1 |
| es lw7 |
| es lw2 |
| lw lw1 |
| lw lw7 |
| lw lw2 |
| lwn lw1 |
| lwn lw7 |
| lwn lw2 |
Original plots of the data by MOBY hour Note this is the first time in a long time we have had a 00 hour file so there are no averages for this data or other deployments (close in time) to compare the 00 hour data too. So the graphs will look quite different.
In the legends "last 3" refers to the last three deployments of data. So you can see the were the data falls compared to other MOBY data.
So the Lu shown under Lw1 is the LuTop data and the Es shown under Lw1 is the Es for the LuTop data. Ditto for Lw7 and LuMid.
Below the Lu/Es graphs there are the plots showing the ratio of the red spec to the blue spec for Es and Ed data. This is the correction applied to the Es and Ed data to correct for the sticky RSG shutter.
Below the Lu/Es graphs there are the blue red offset graphs so this can be monitored during the deployment. The graphs are by hour and sensor (Es, Ed and Lu) and show the previous 4 deployemnts for reference.
Figure 1

Figure 2
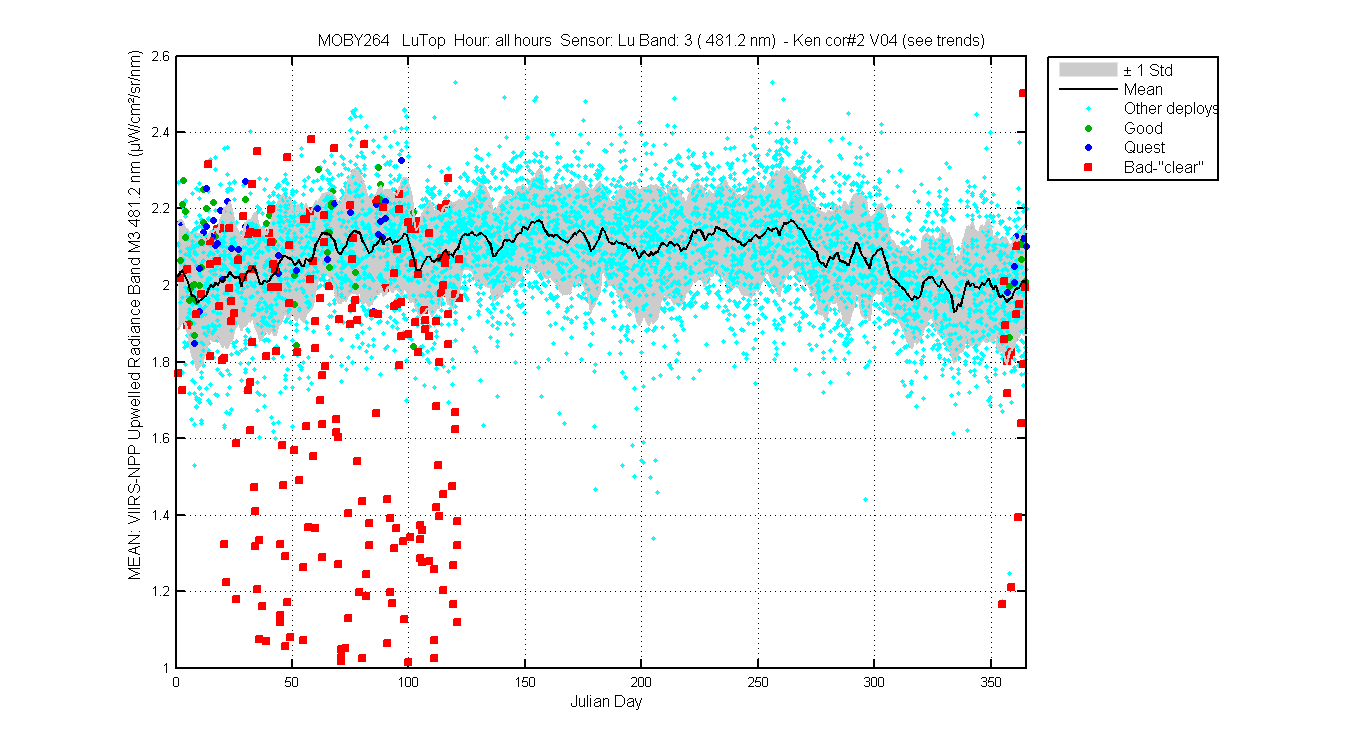
Figure 3
Figure 4
Figure 5
Figure 6
Figure 7

Figure 1
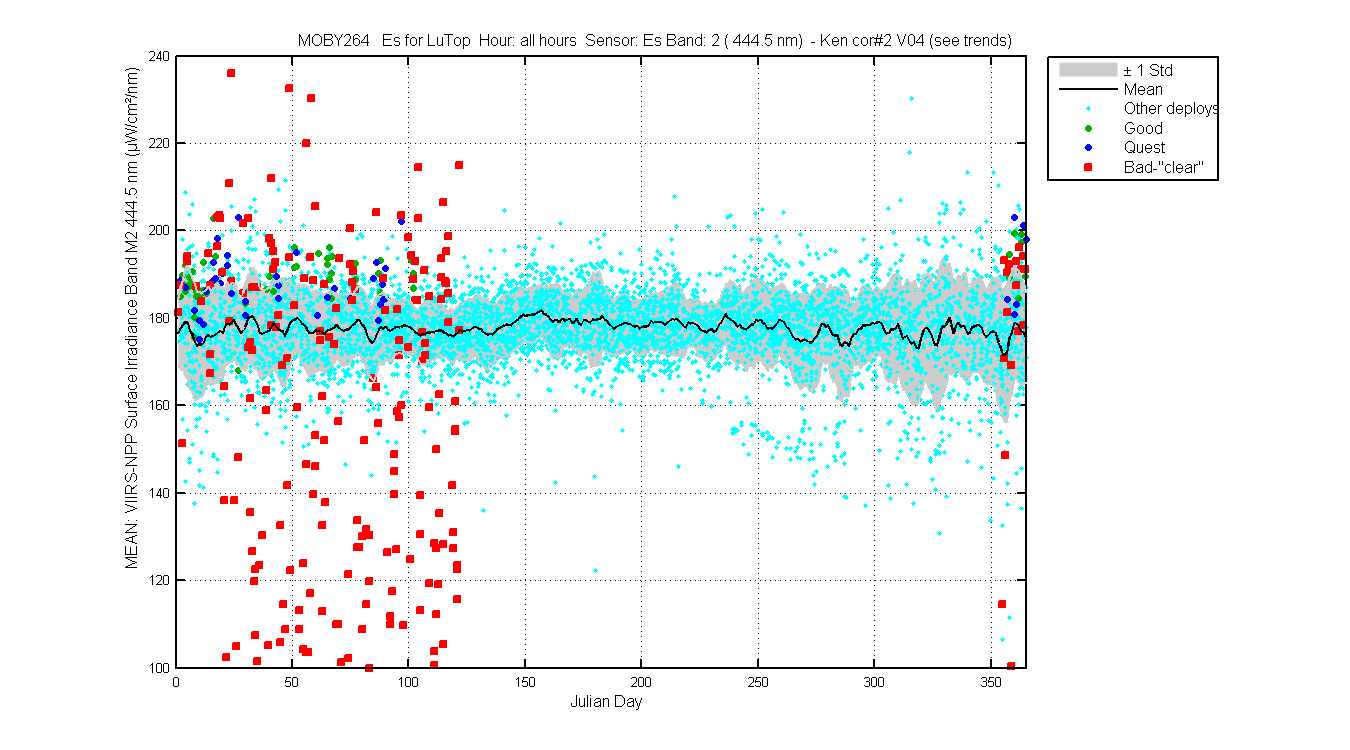
Figure 2
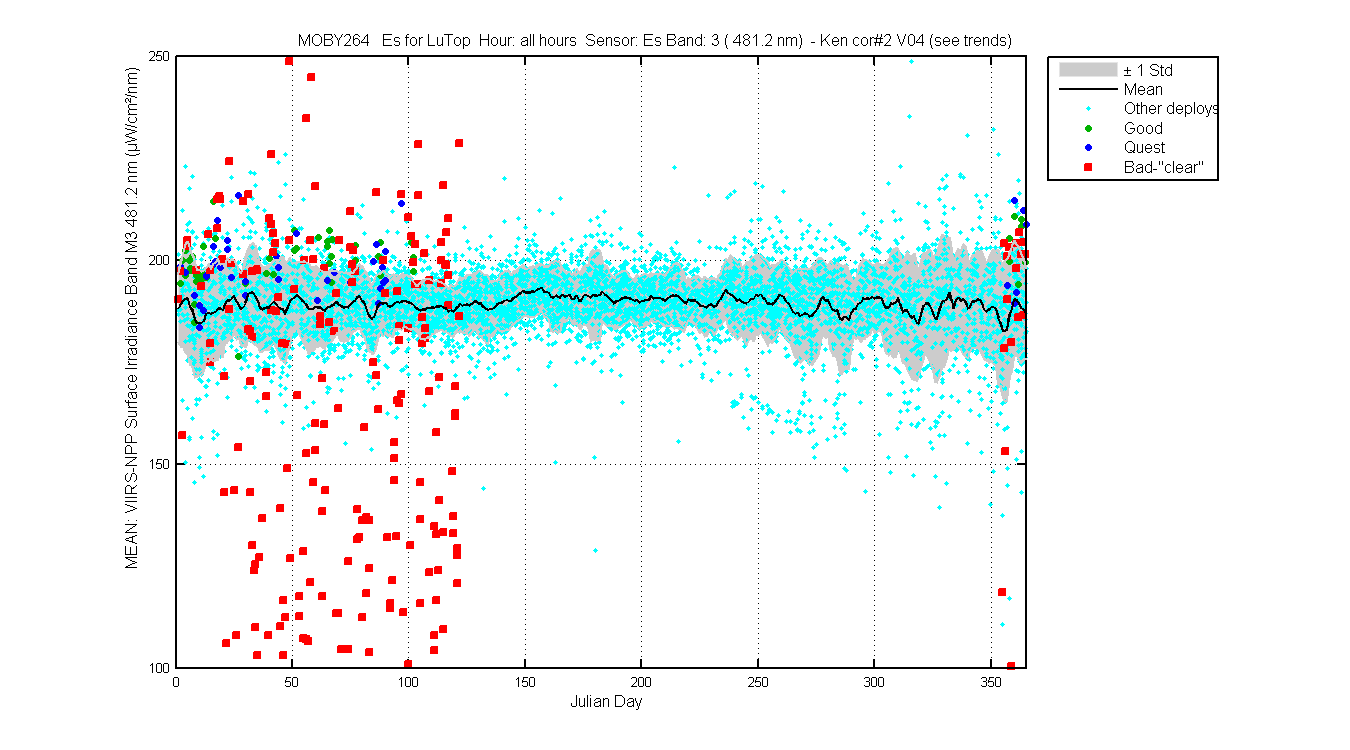
Figure 3
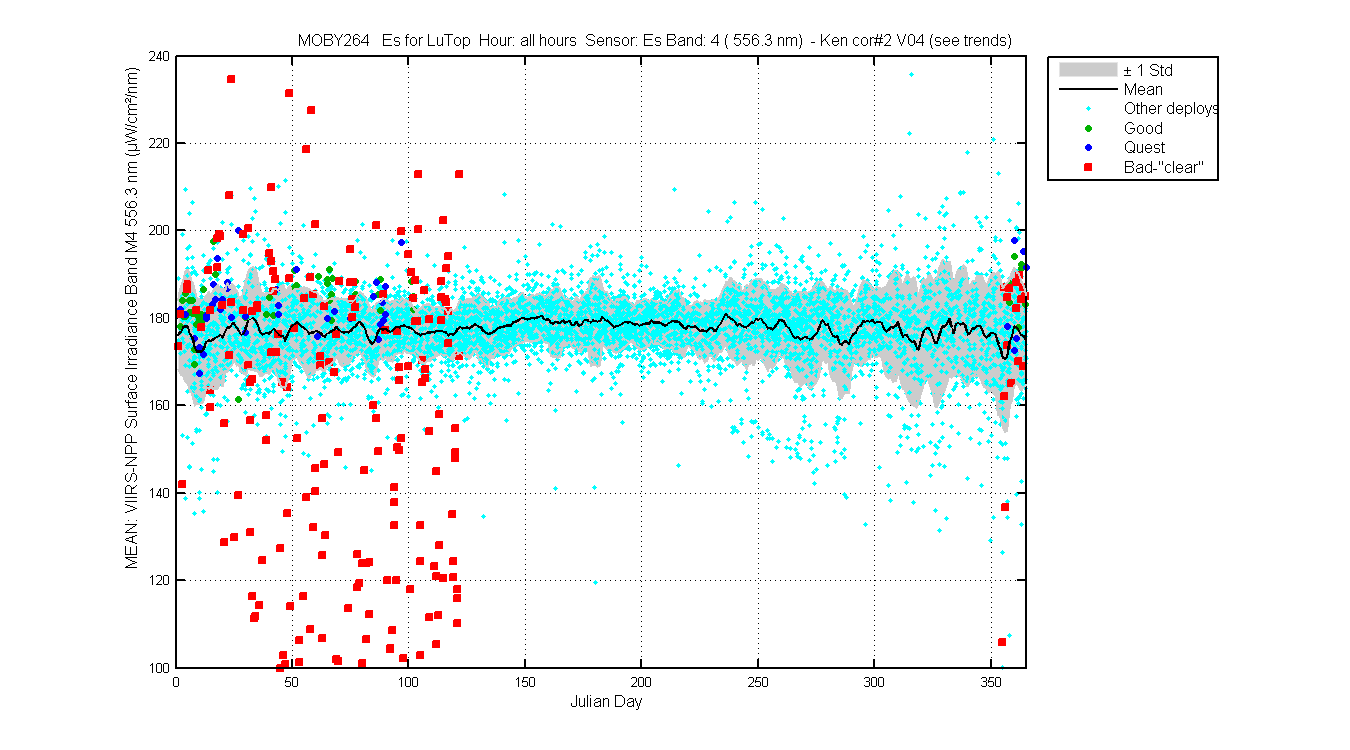
Figure 4
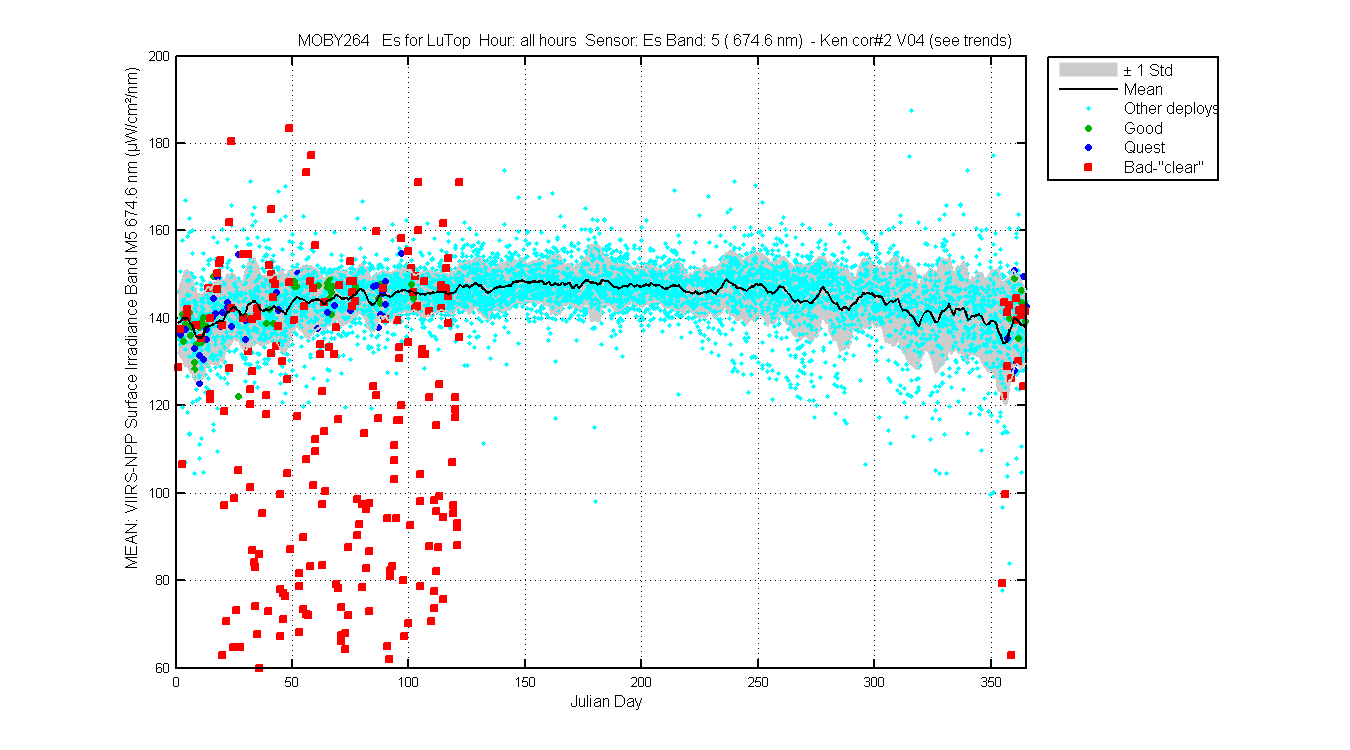
Figure 5
Figure 6
Figure 7
Figure 1

Figure 2
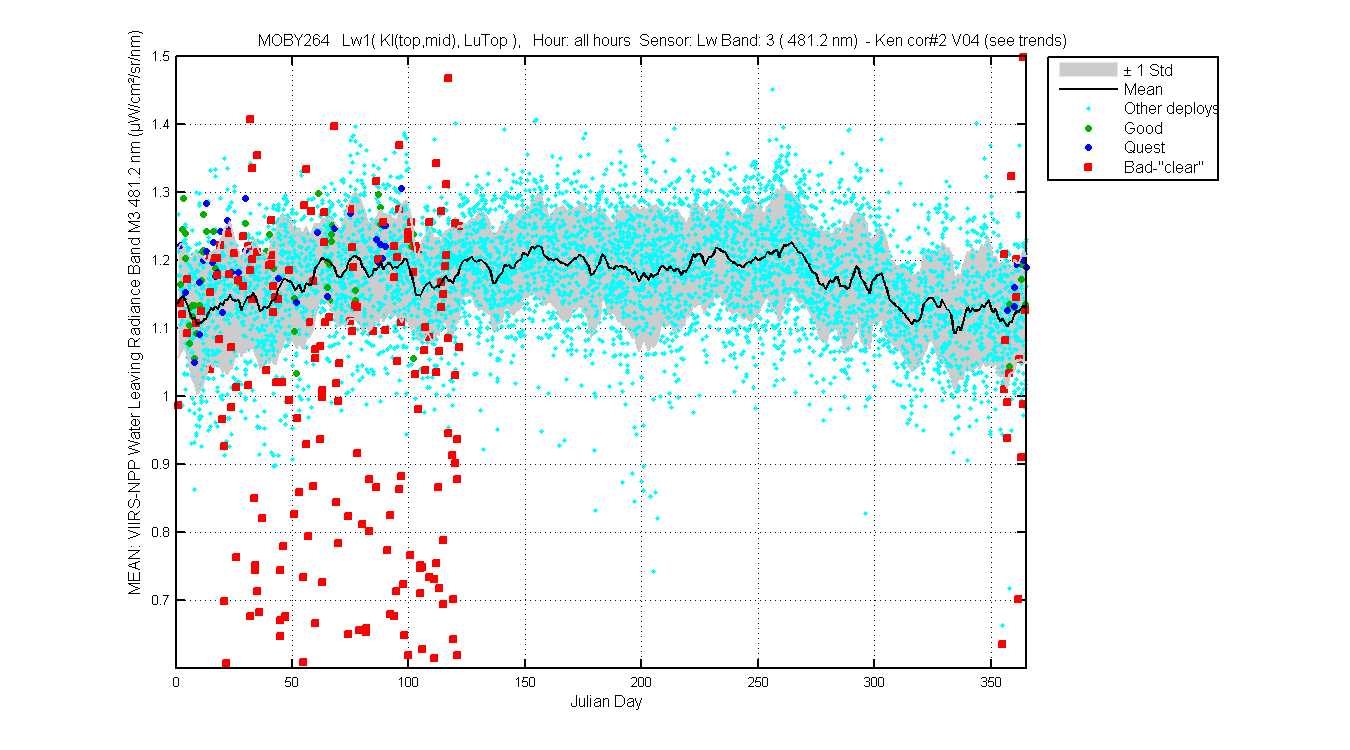
Figure 3
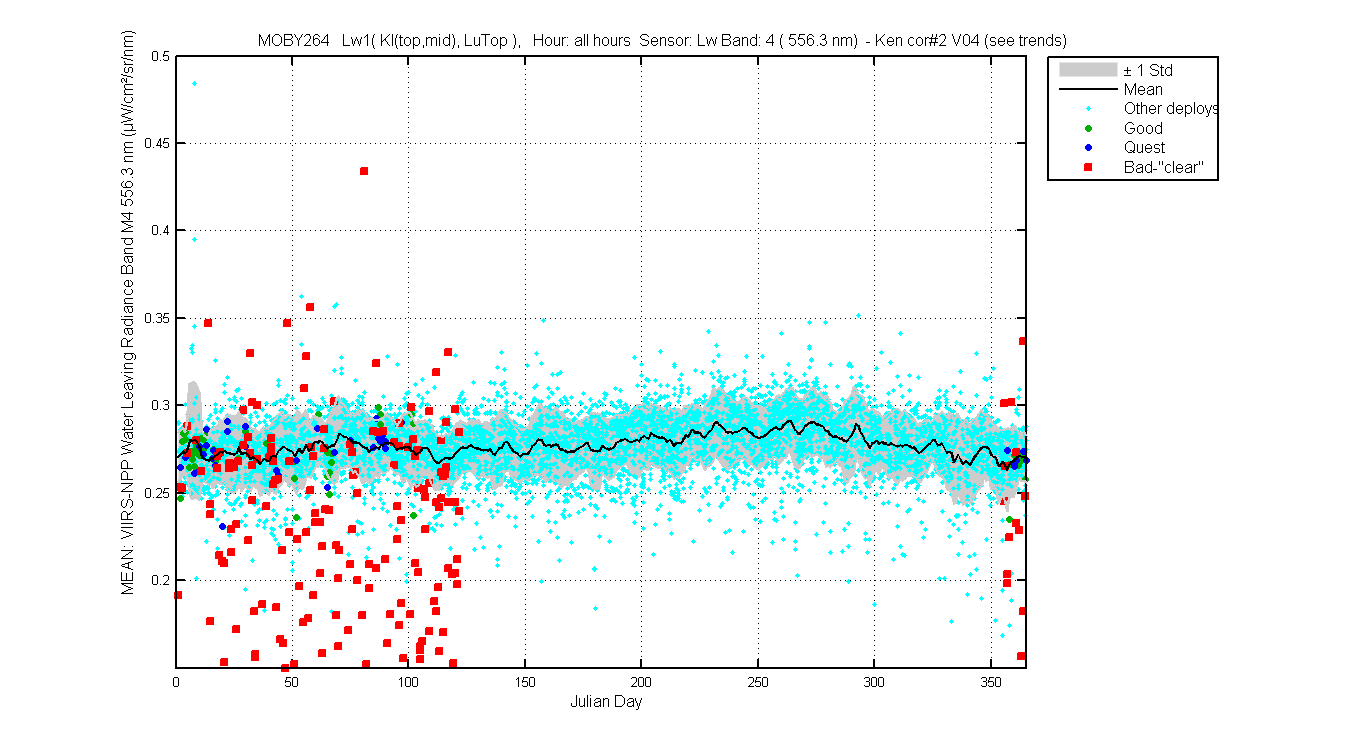
Figure 4
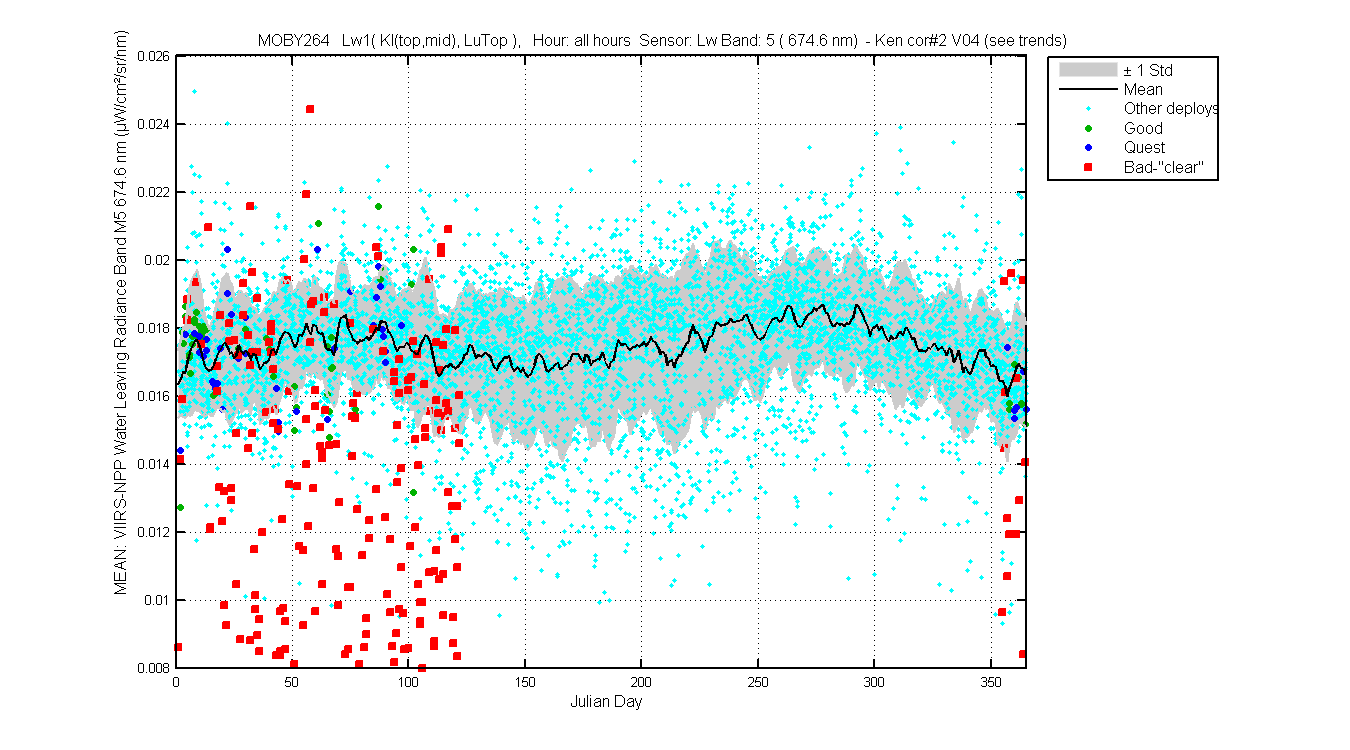
Figure 5
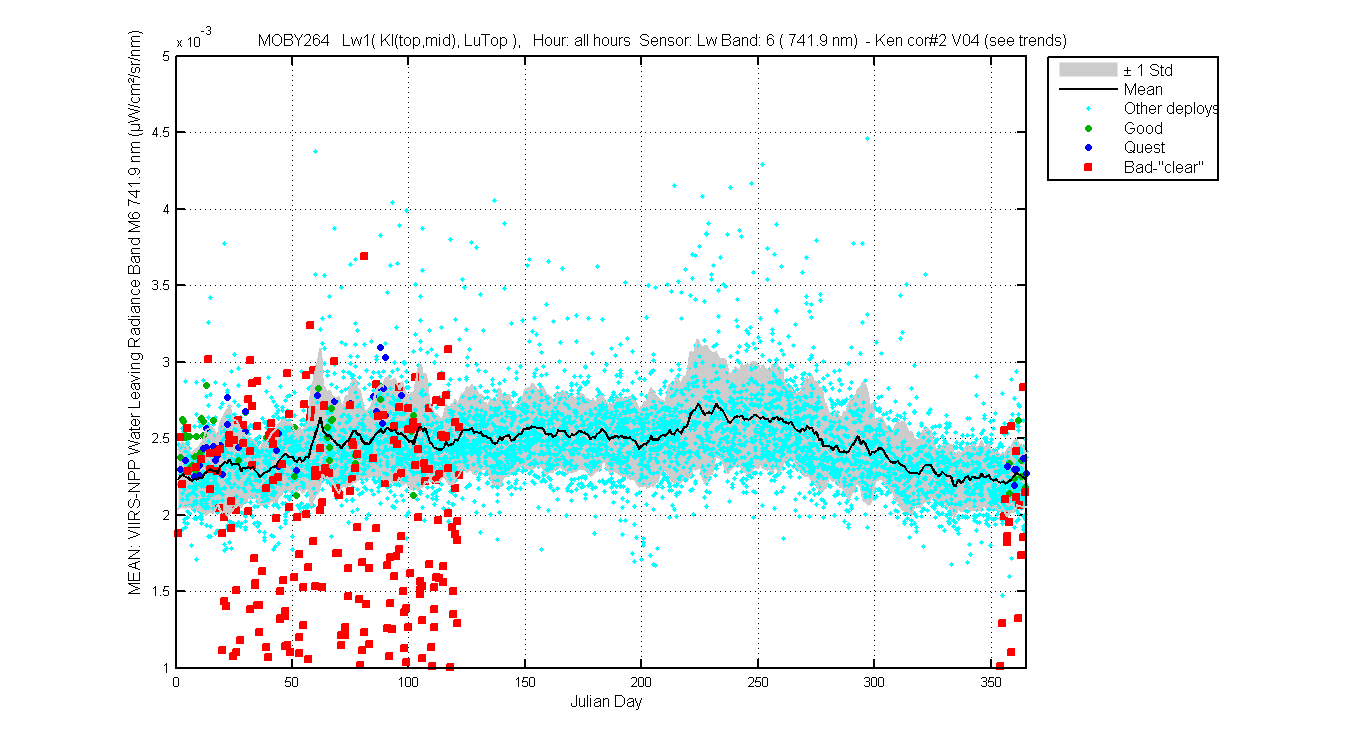
Figure 6

Figure 7
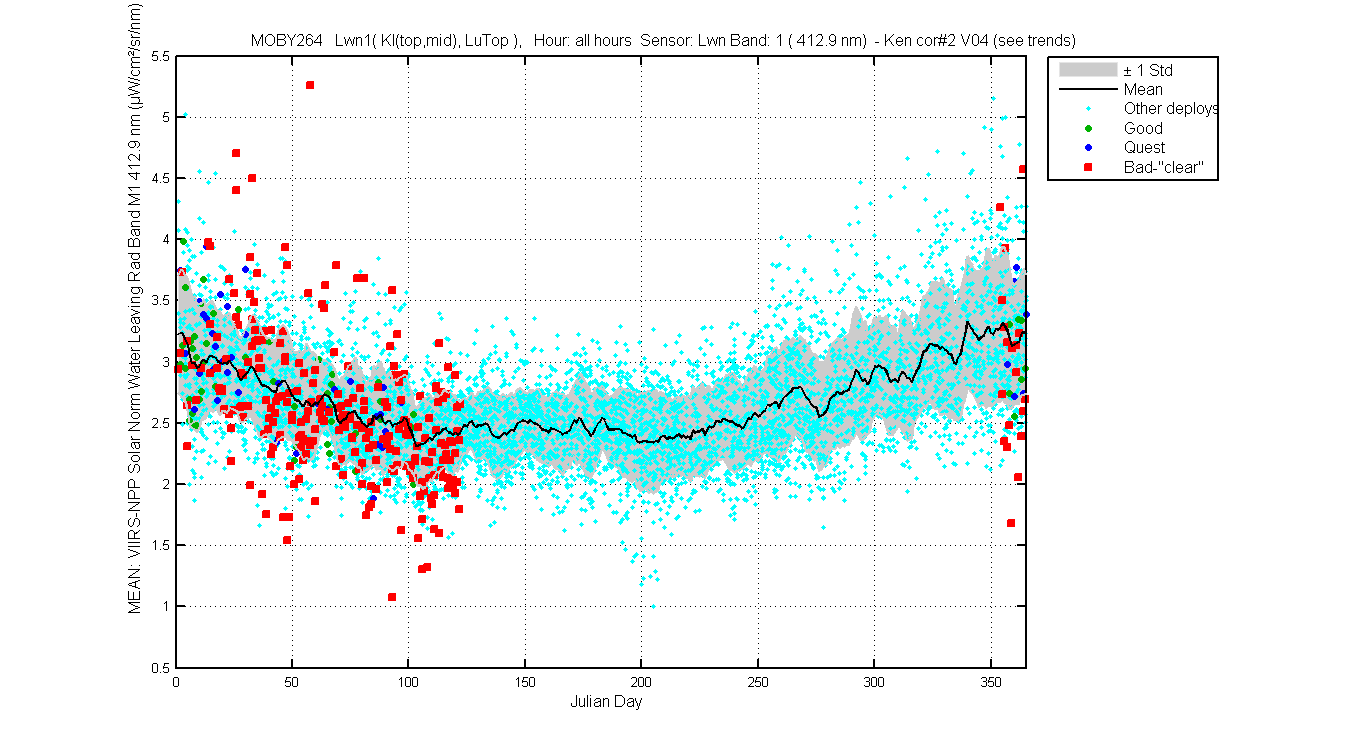
Figure 1
Figure 2

Figure 3
Figure 4
Figure 5
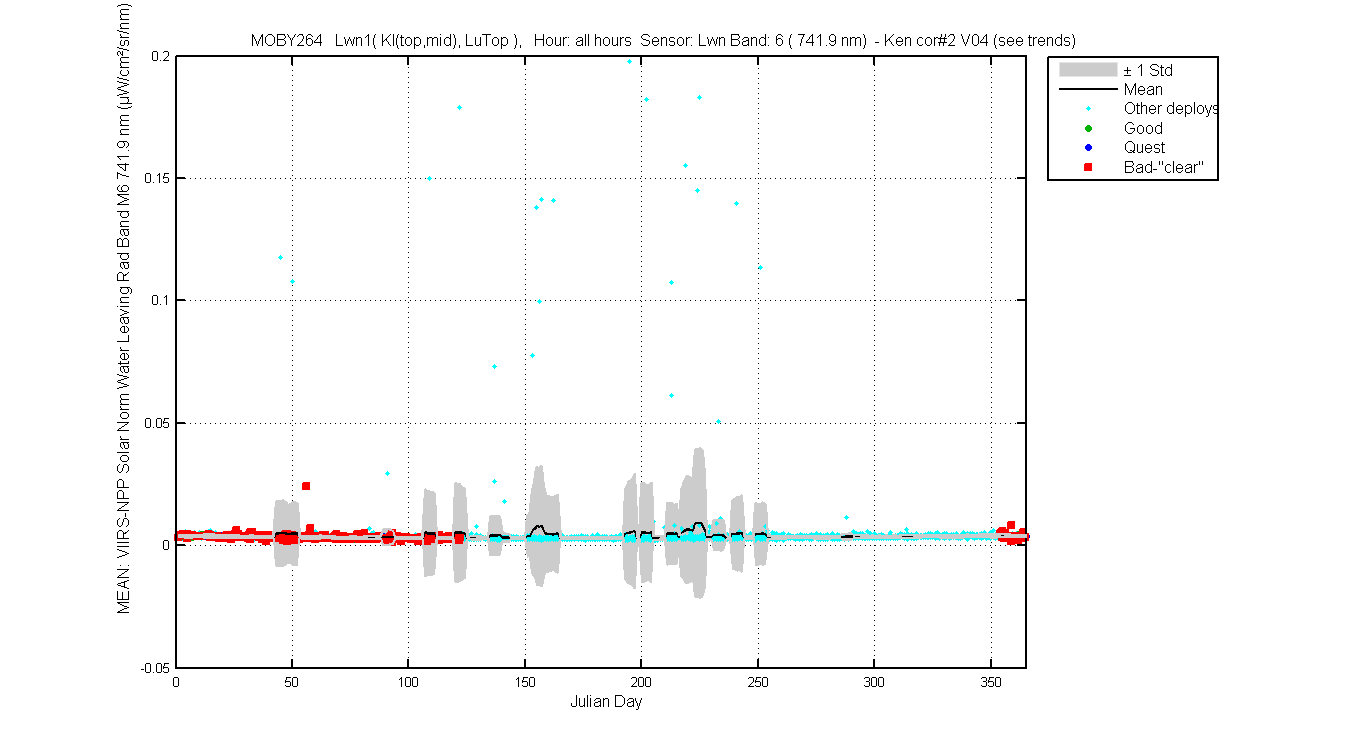
Figure 6

Figure 7
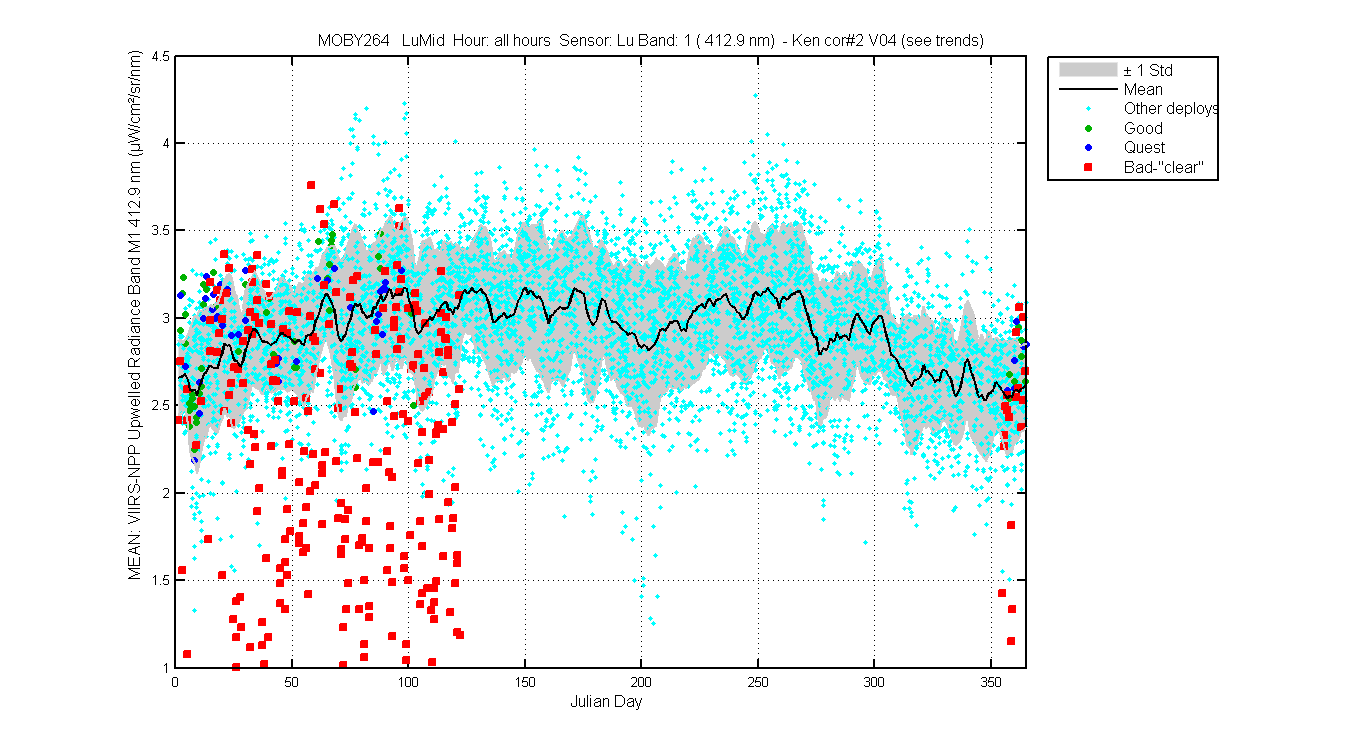
Figure 1
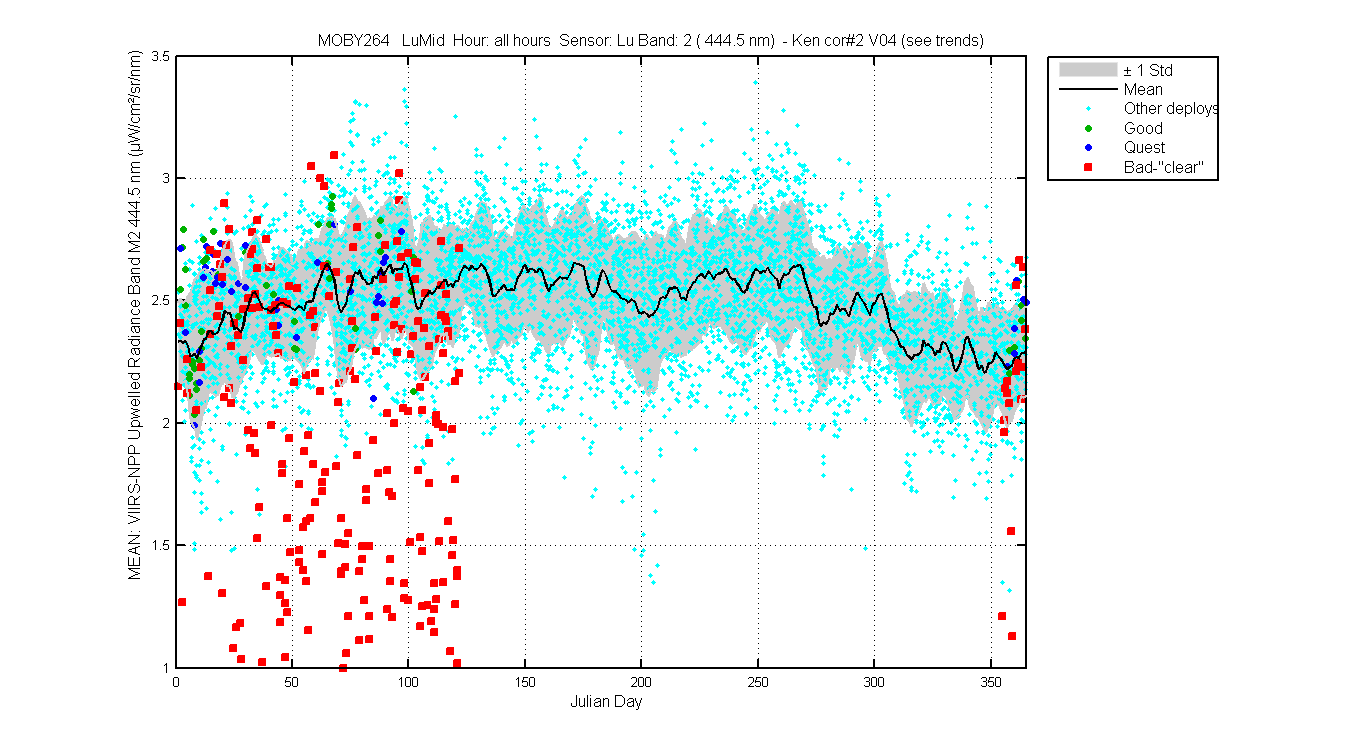
Figure 2
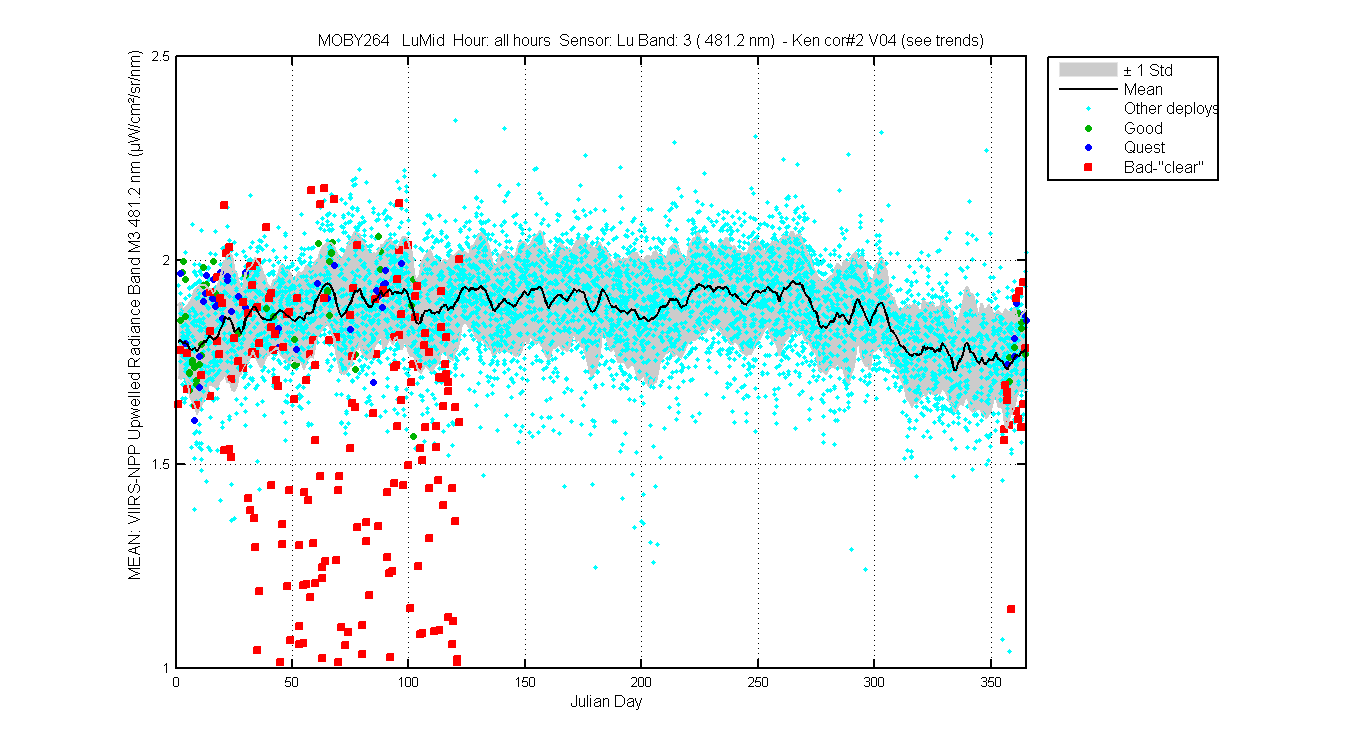
Figure 3
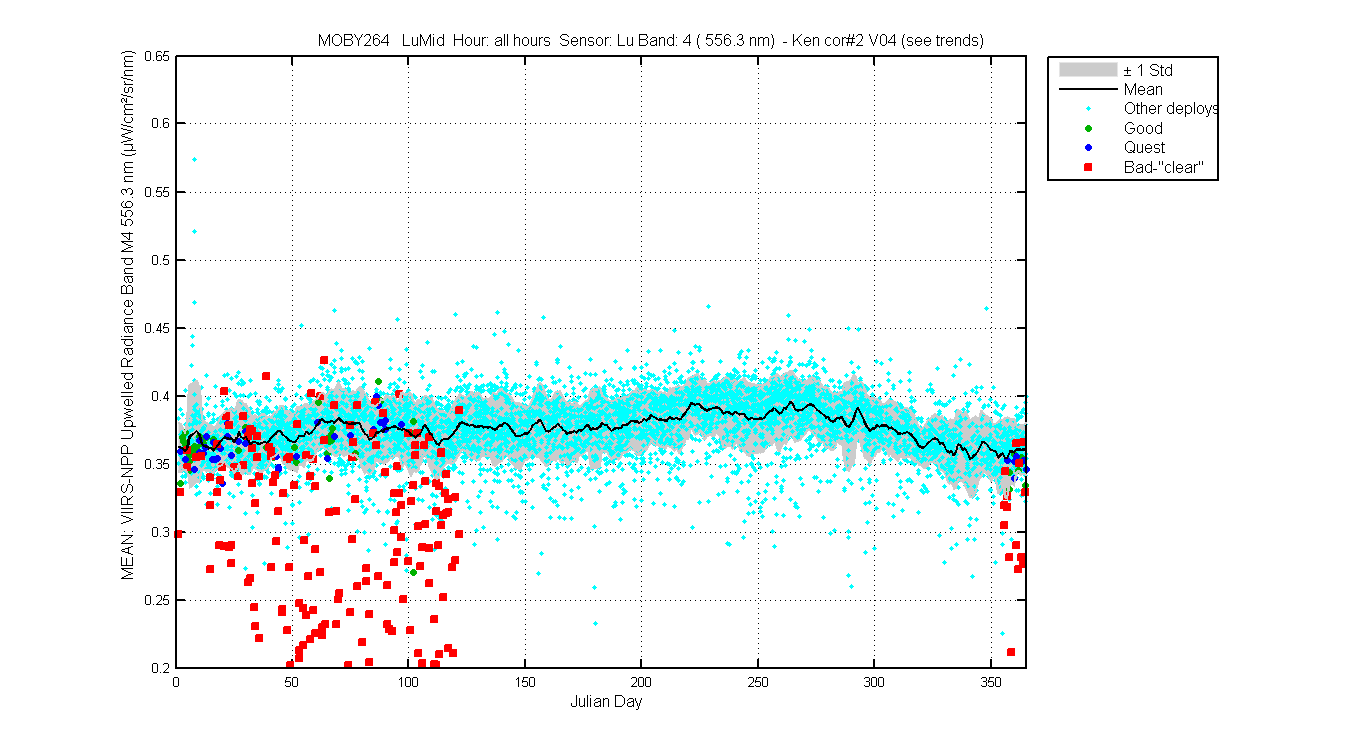
Figure 4
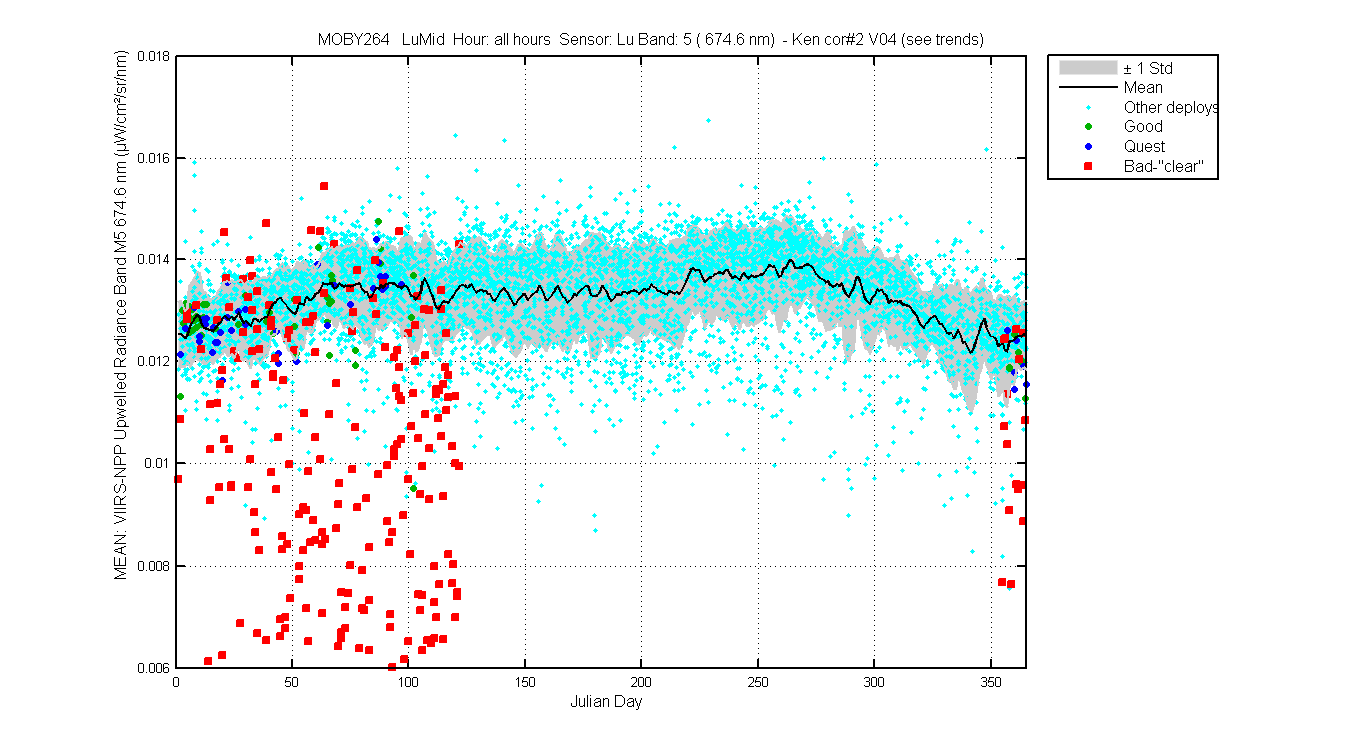
Figure 5
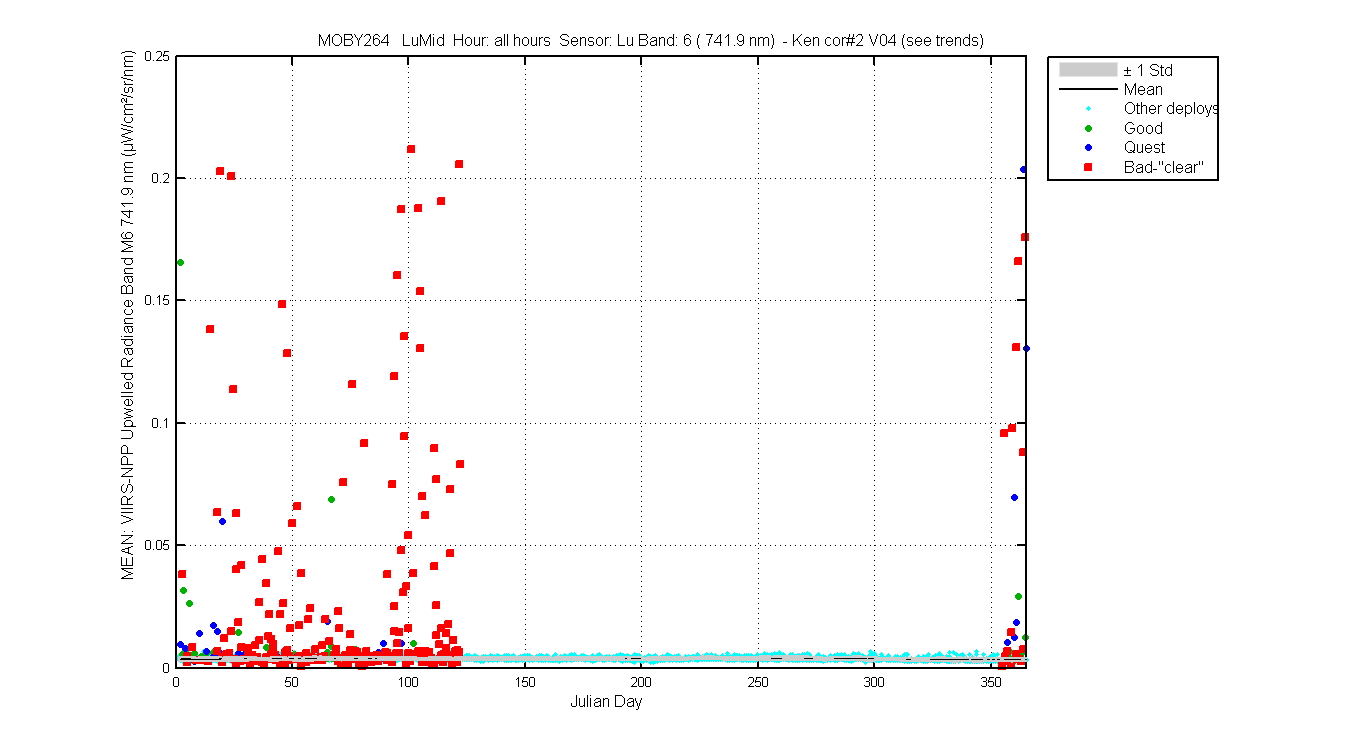
Figure 6

Figure 7
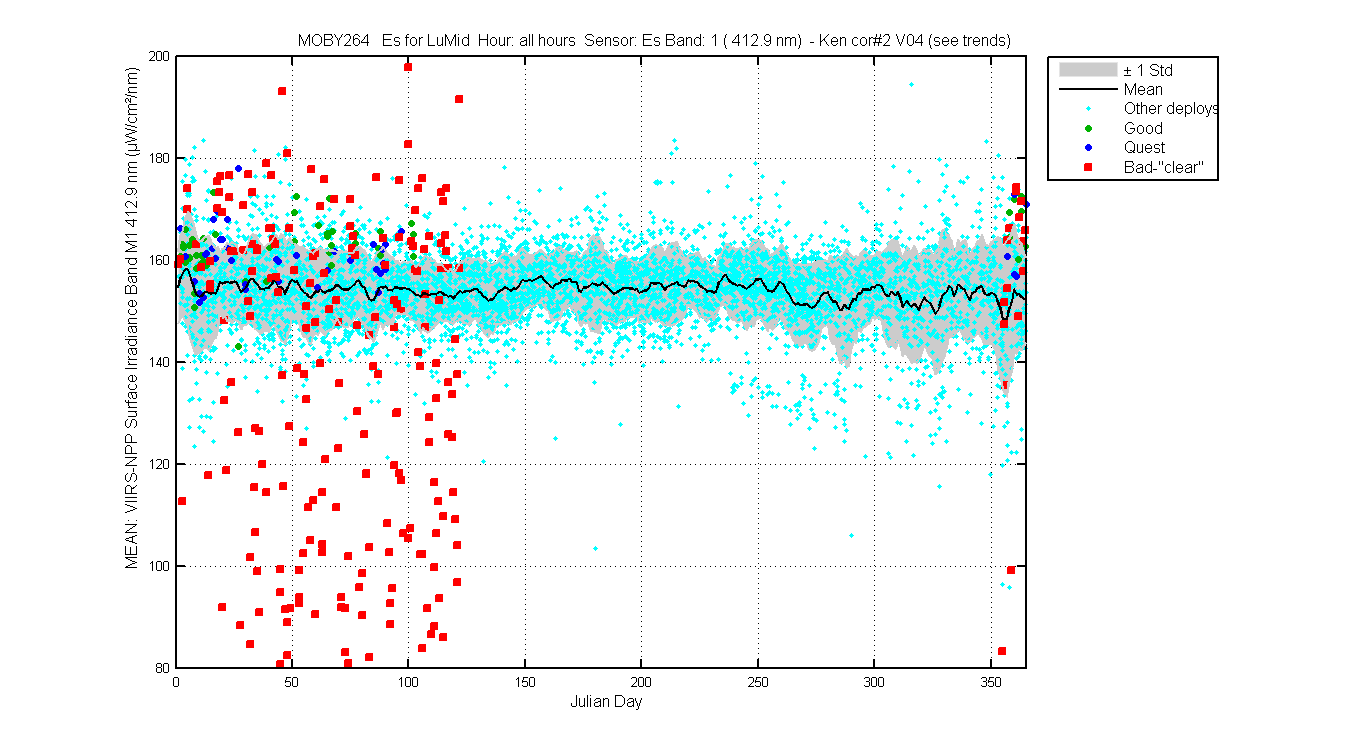
Figure 1
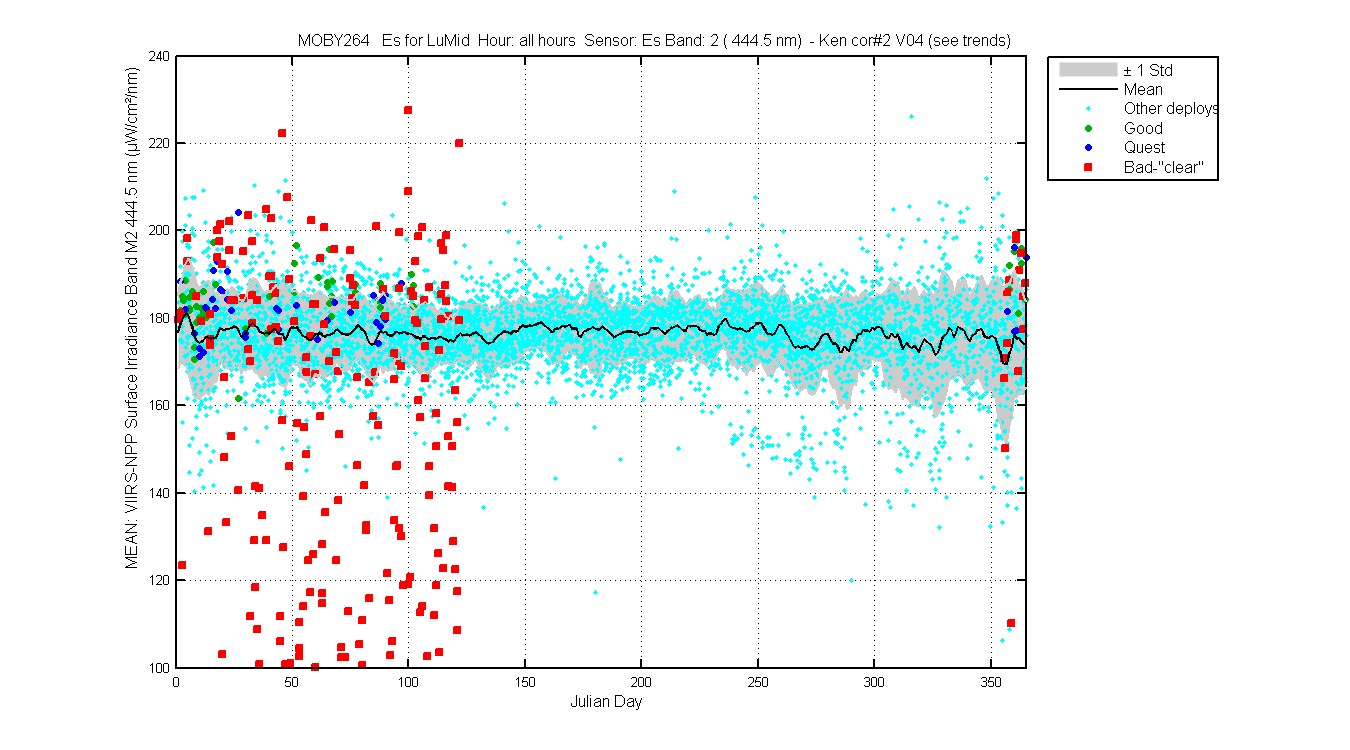
Figure 2
Figure 3
Figure 4
Figure 5
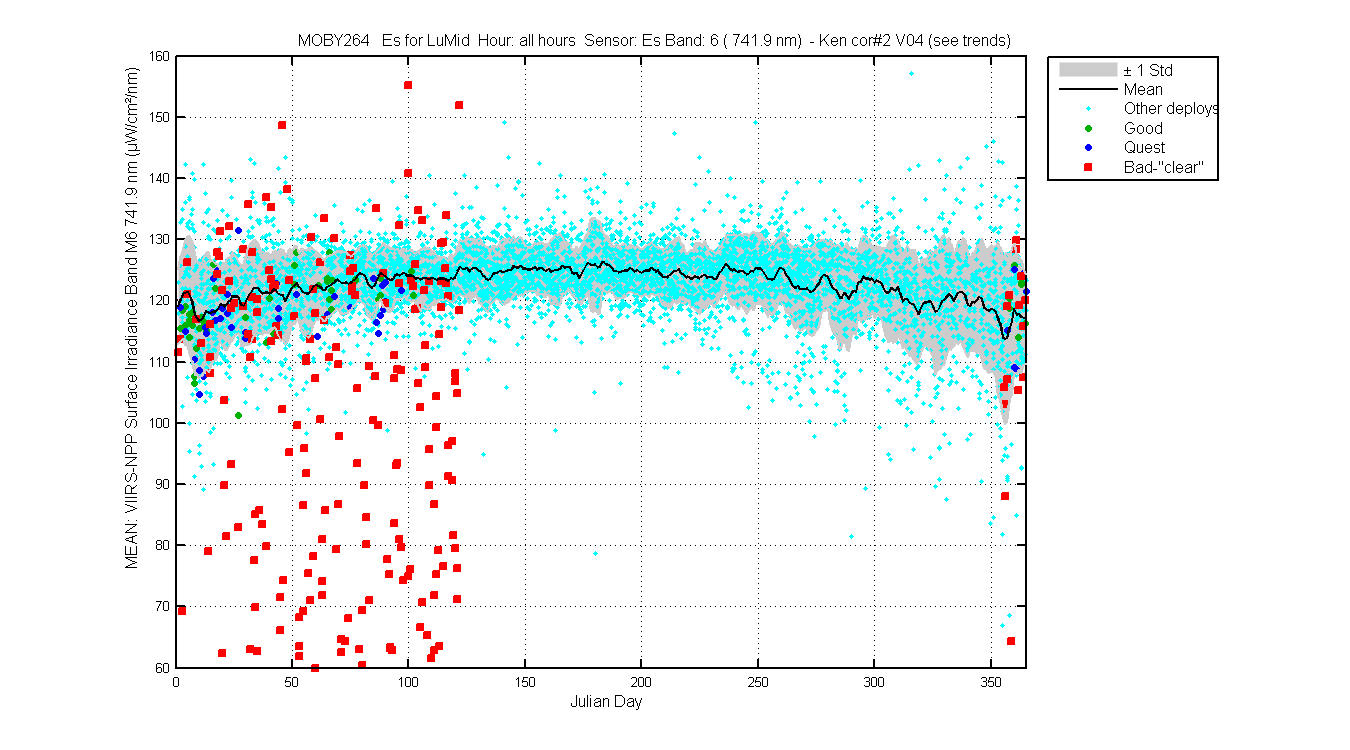
Figure 6

Figure 7
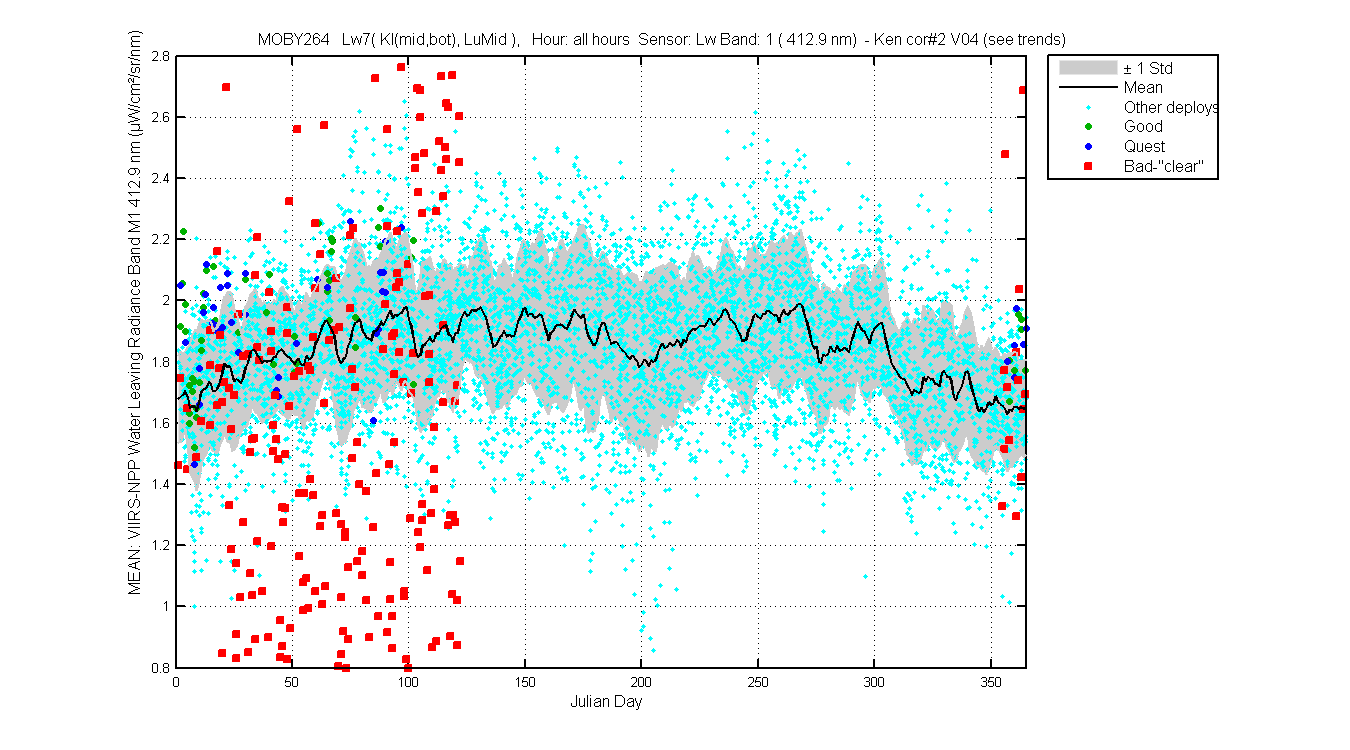
Figure 1
Figure 2
Figure 3
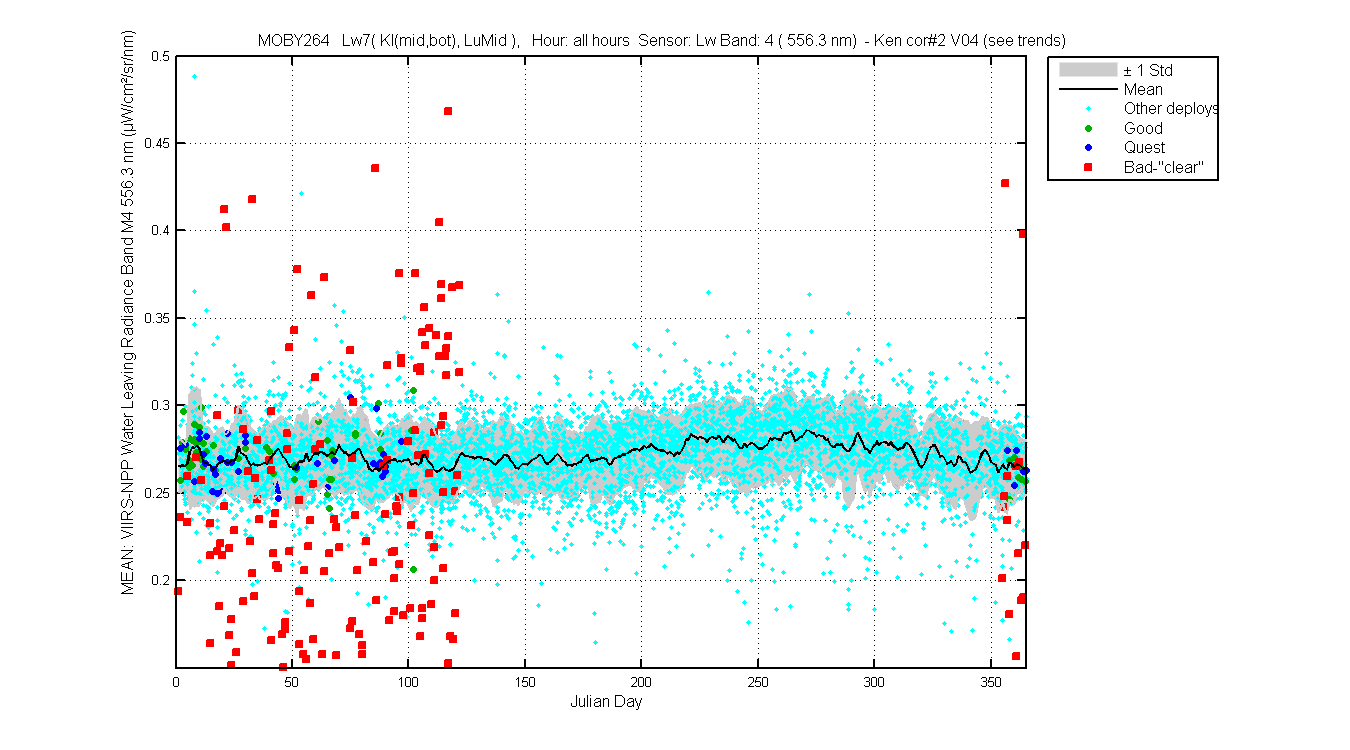
Figure 4

Figure 5
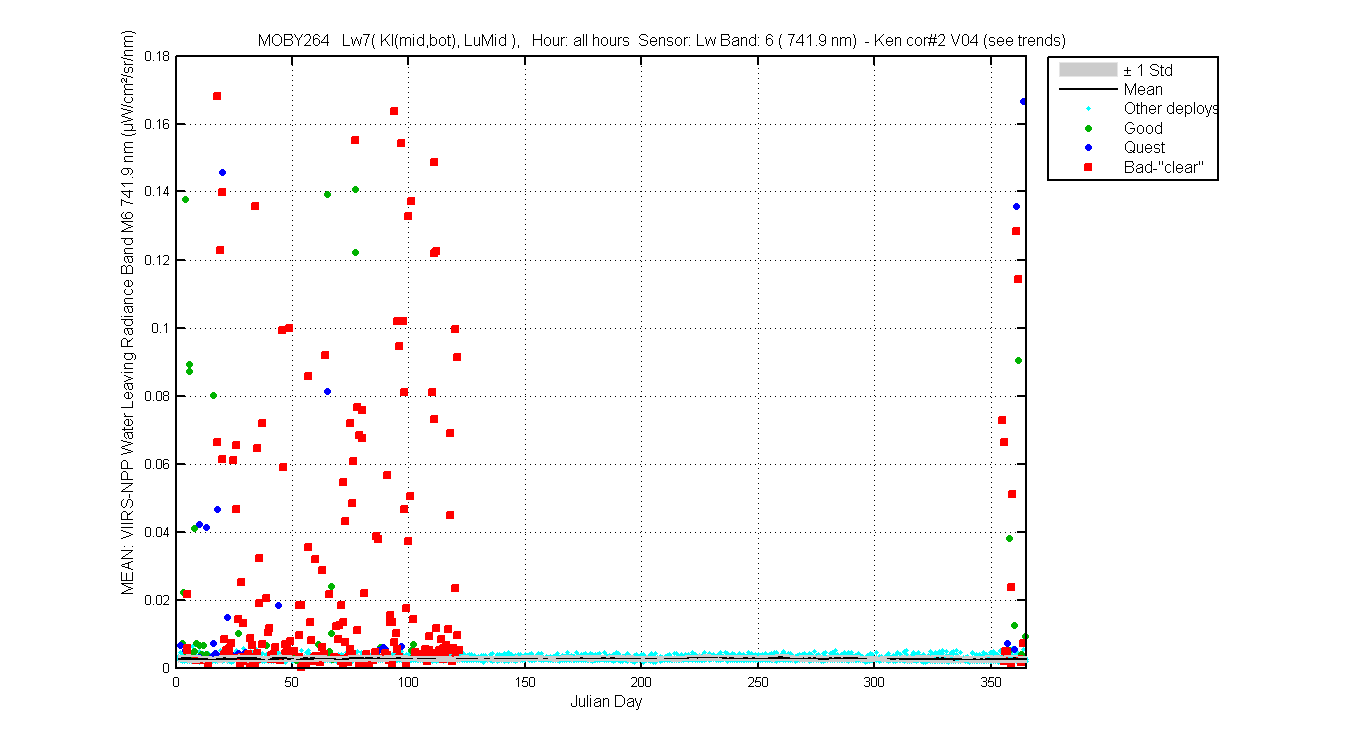
Figure 6

Figure 7
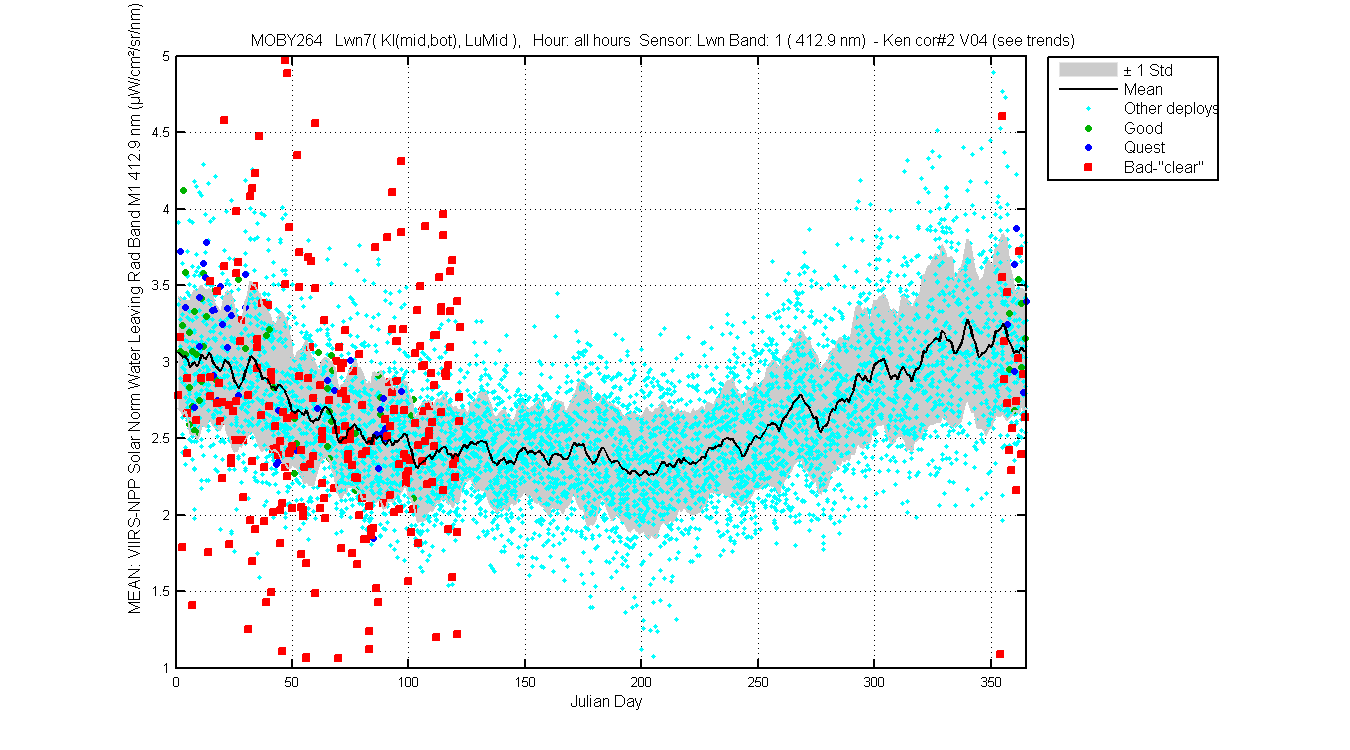
Figure 1
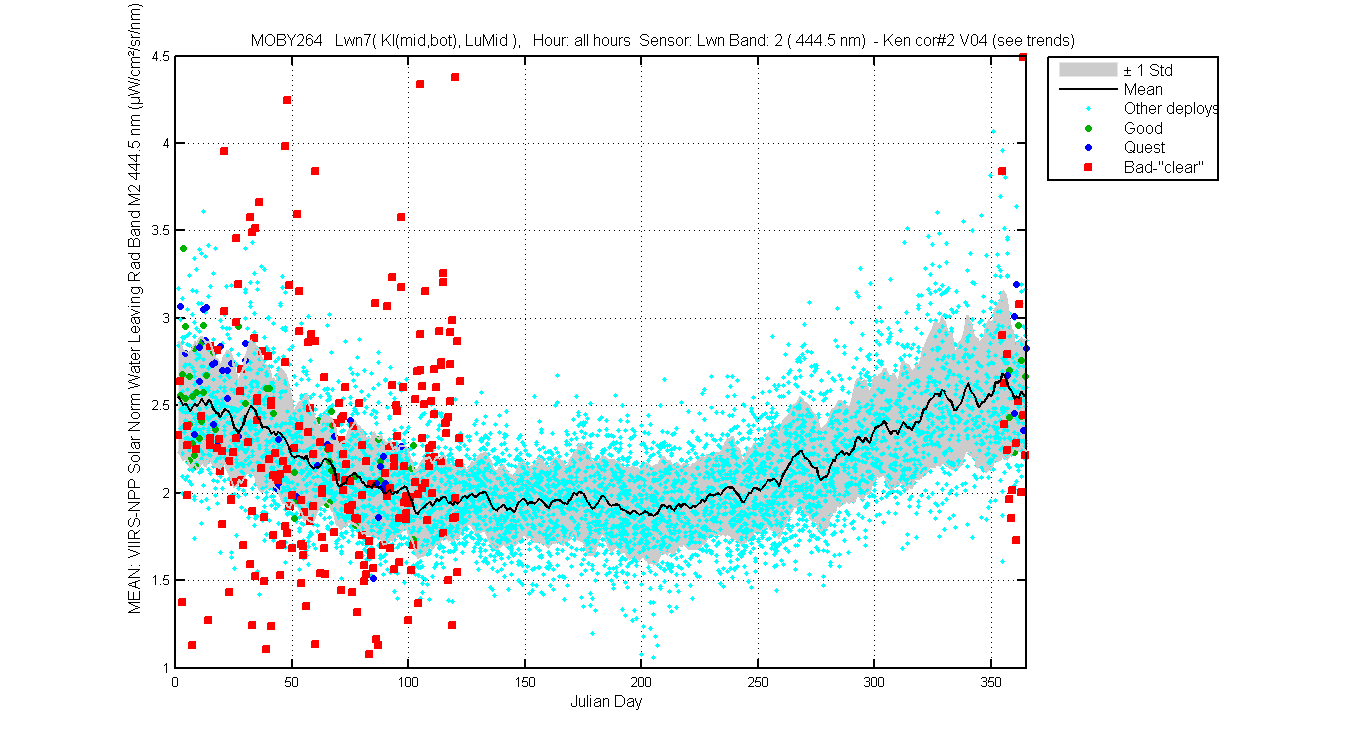
Figure 2
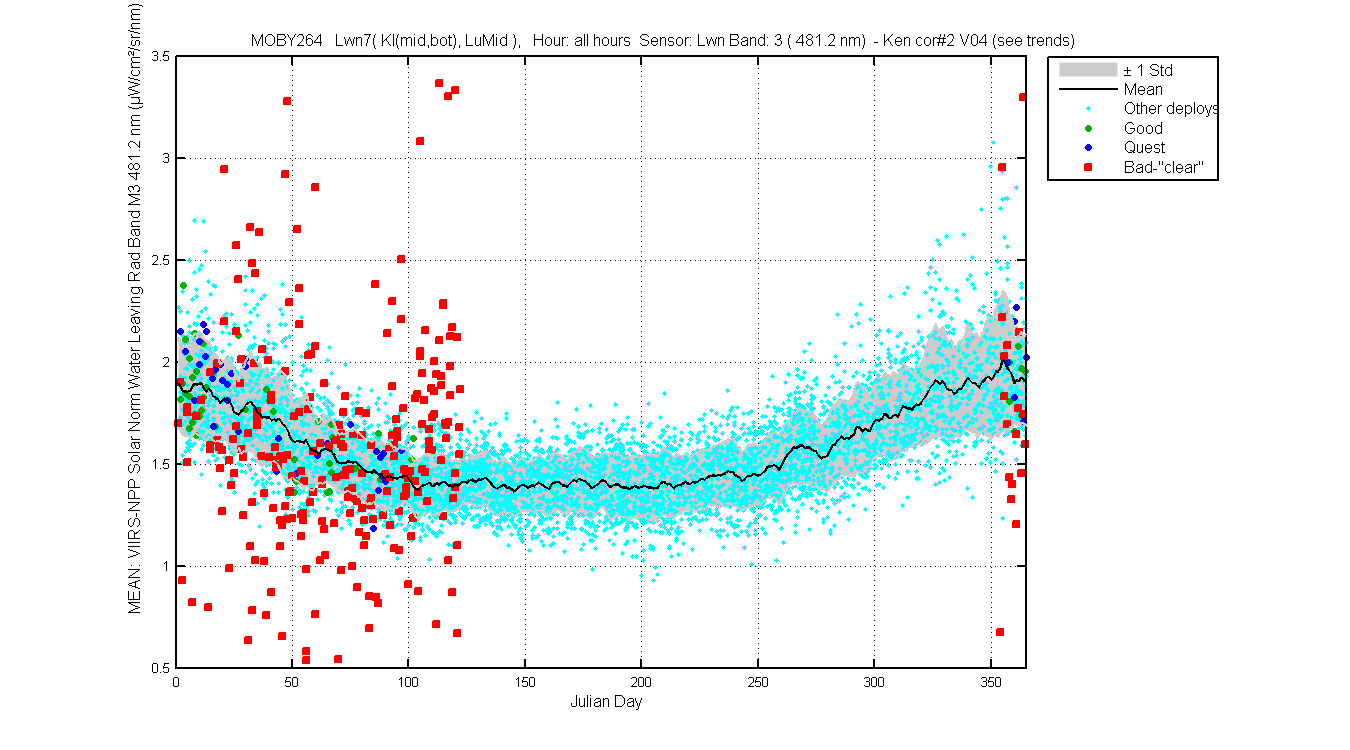
Figure 3
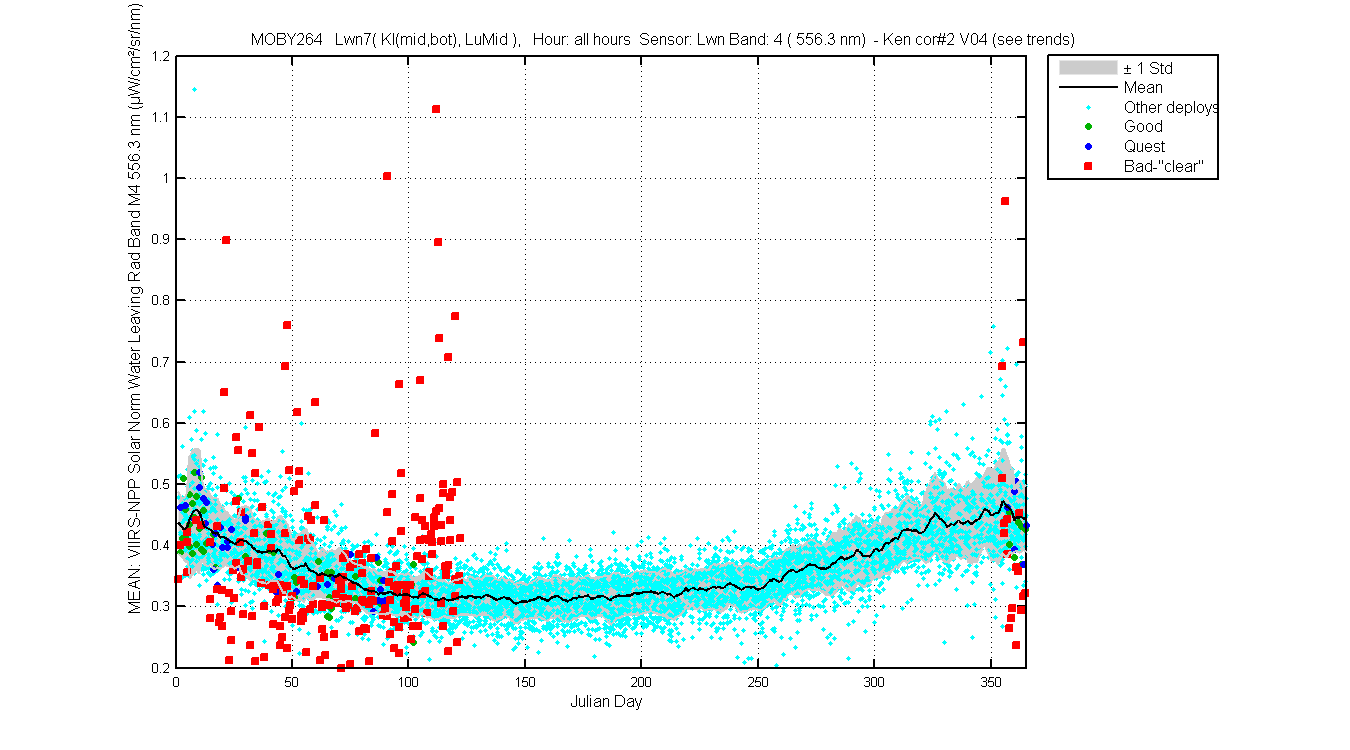
Figure 4
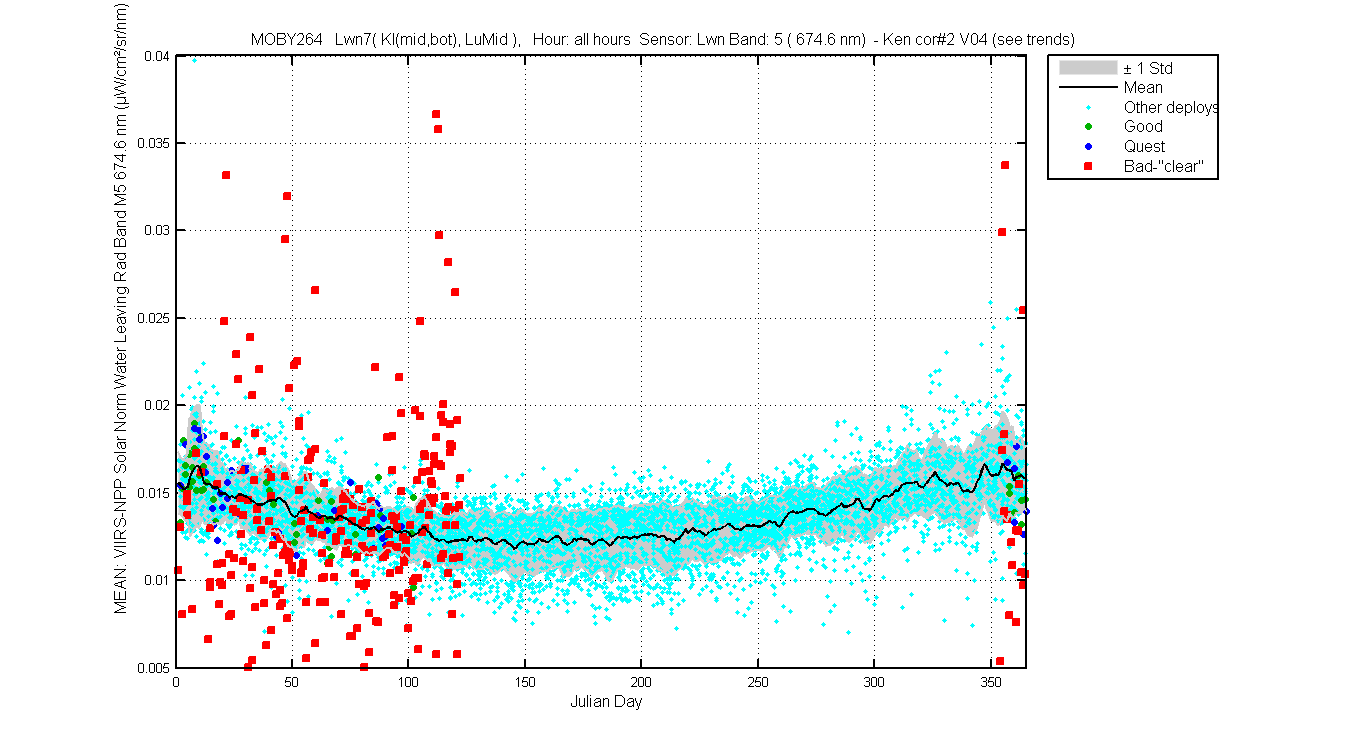
Figure 5
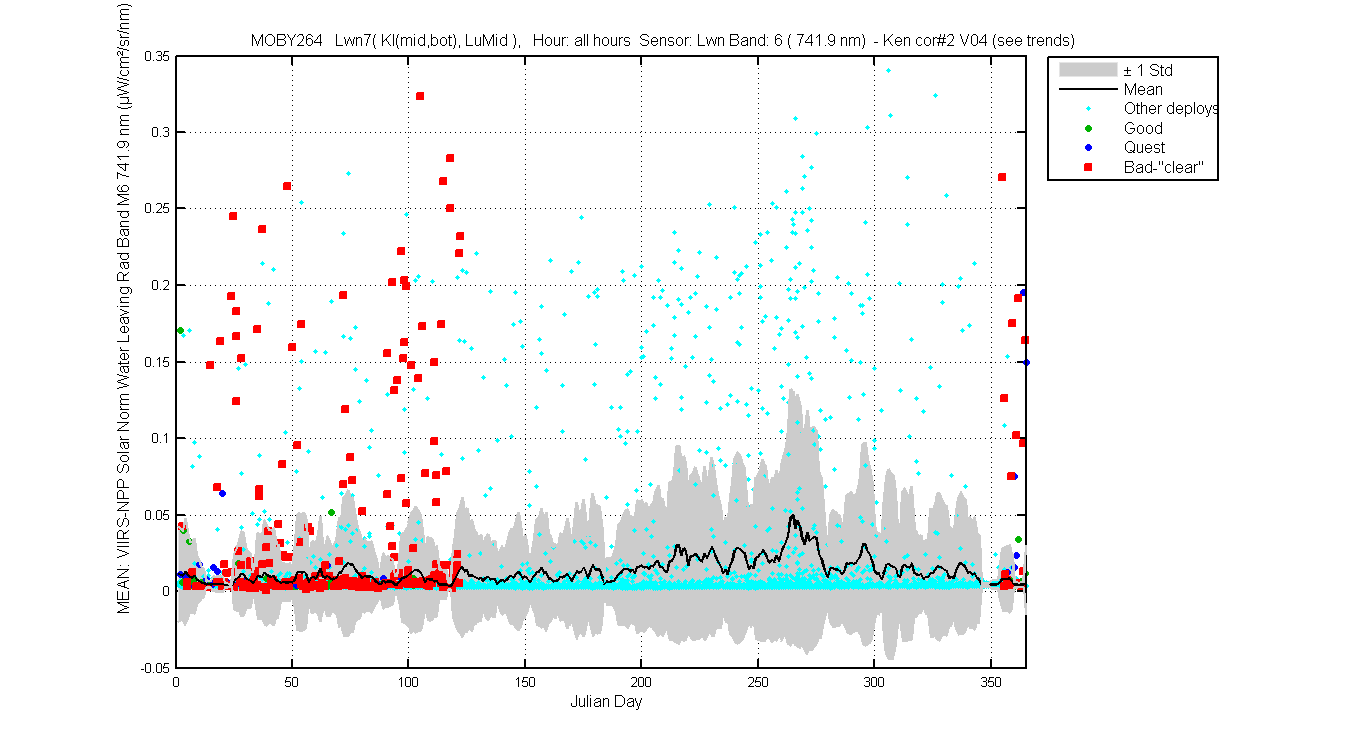
Figure 6

Figure 7

Figure 1
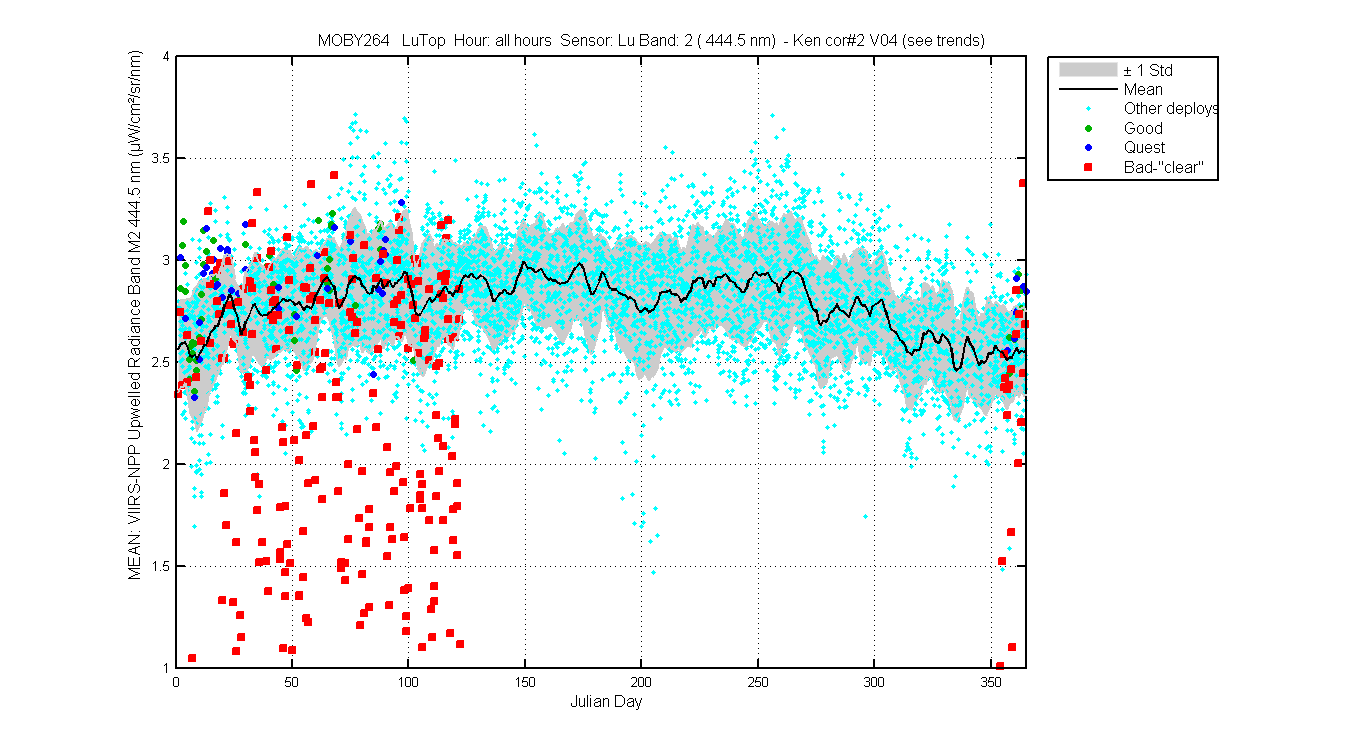
Figure 2
Figure 3

Figure 4
Figure 5
Figure 6

Figure 7
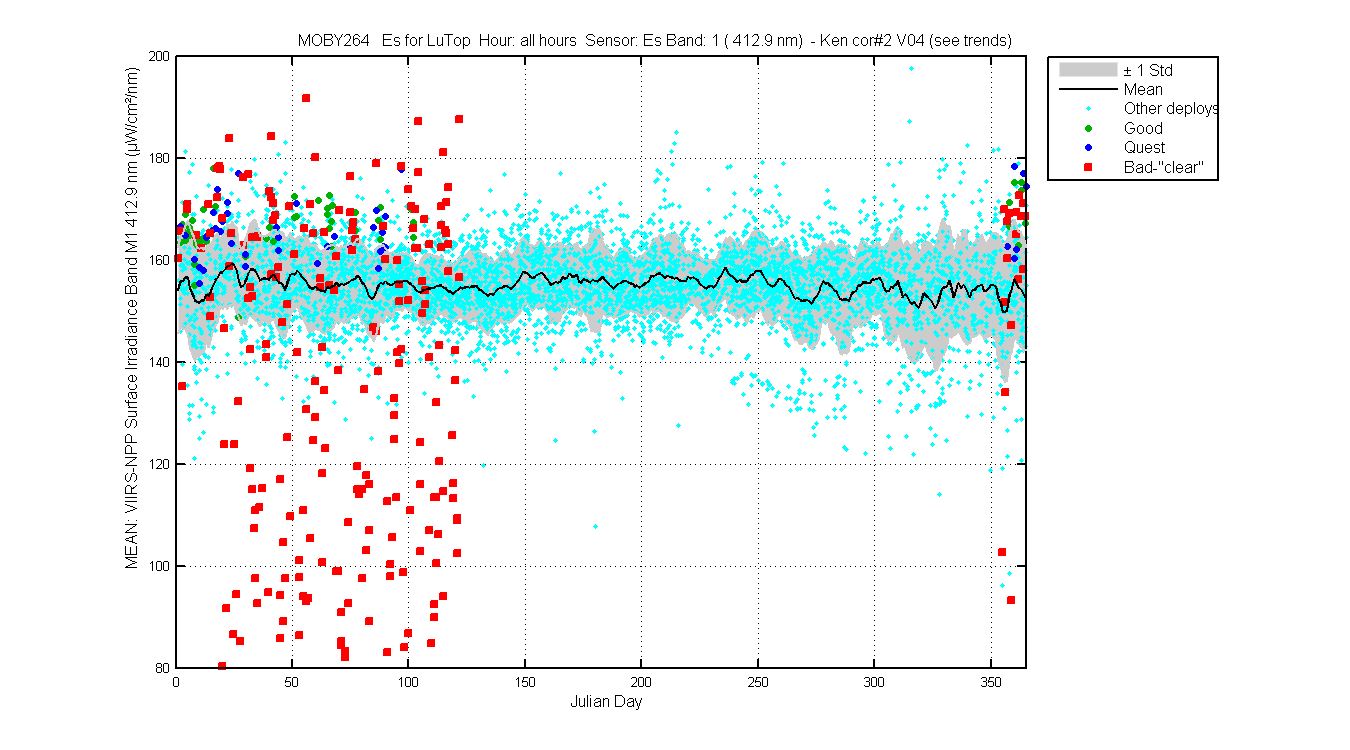
Figure 1
Figure 2
Figure 3
Figure 4

Figure 5

Figure 6
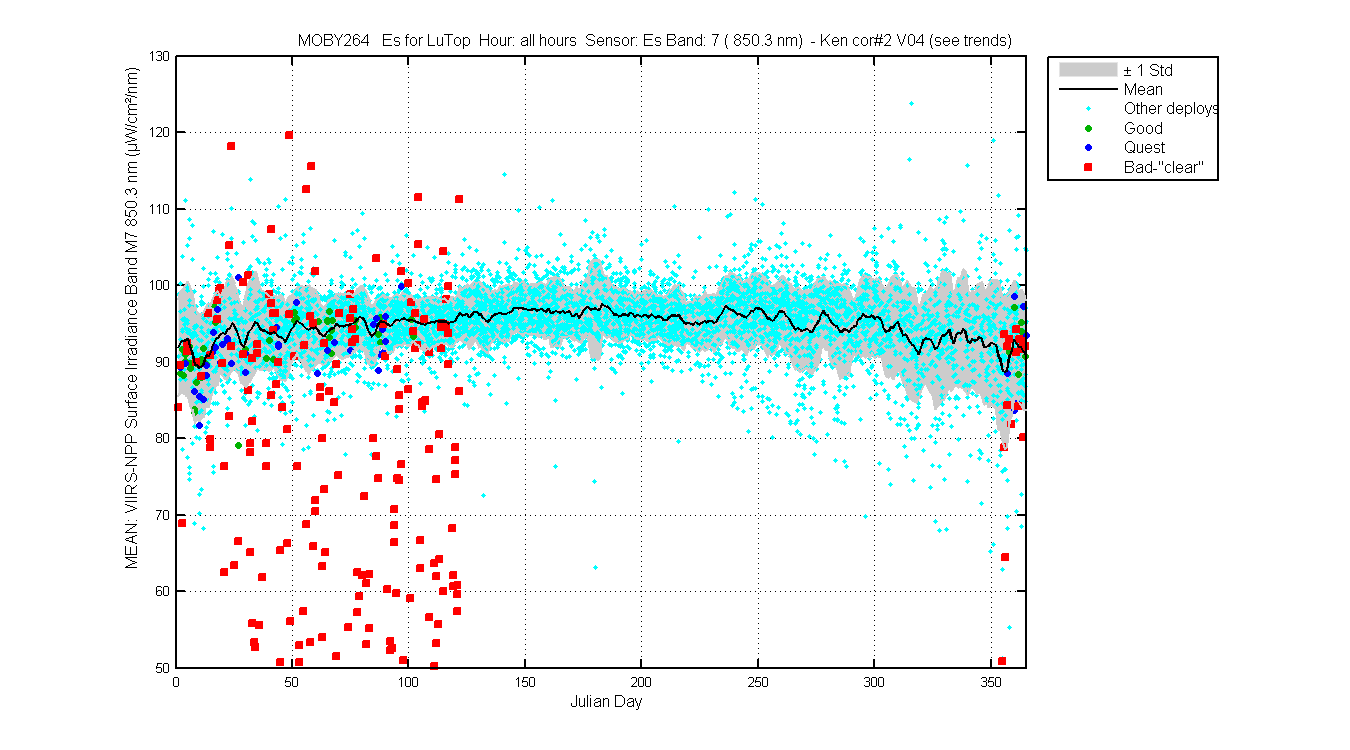
Figure 7

Figure 1
Figure 2
Figure 3
Figure 4
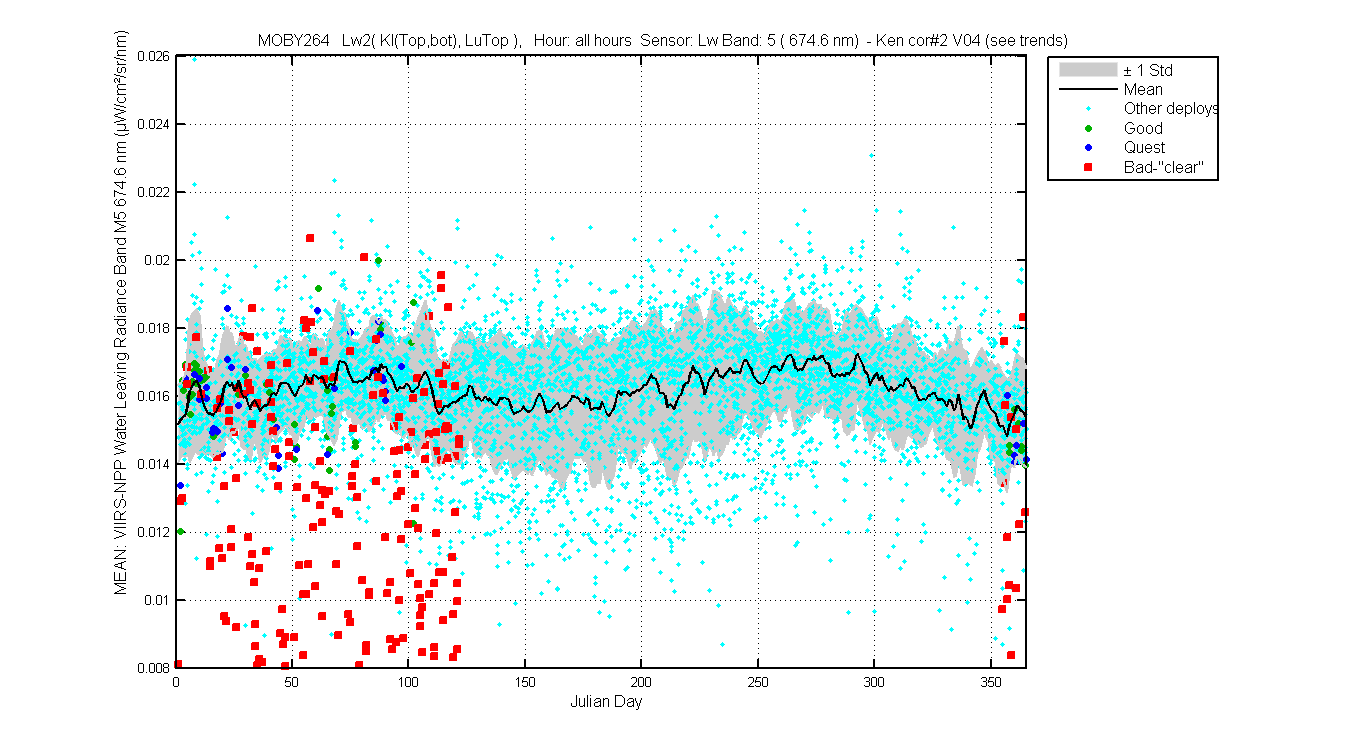
Figure 5
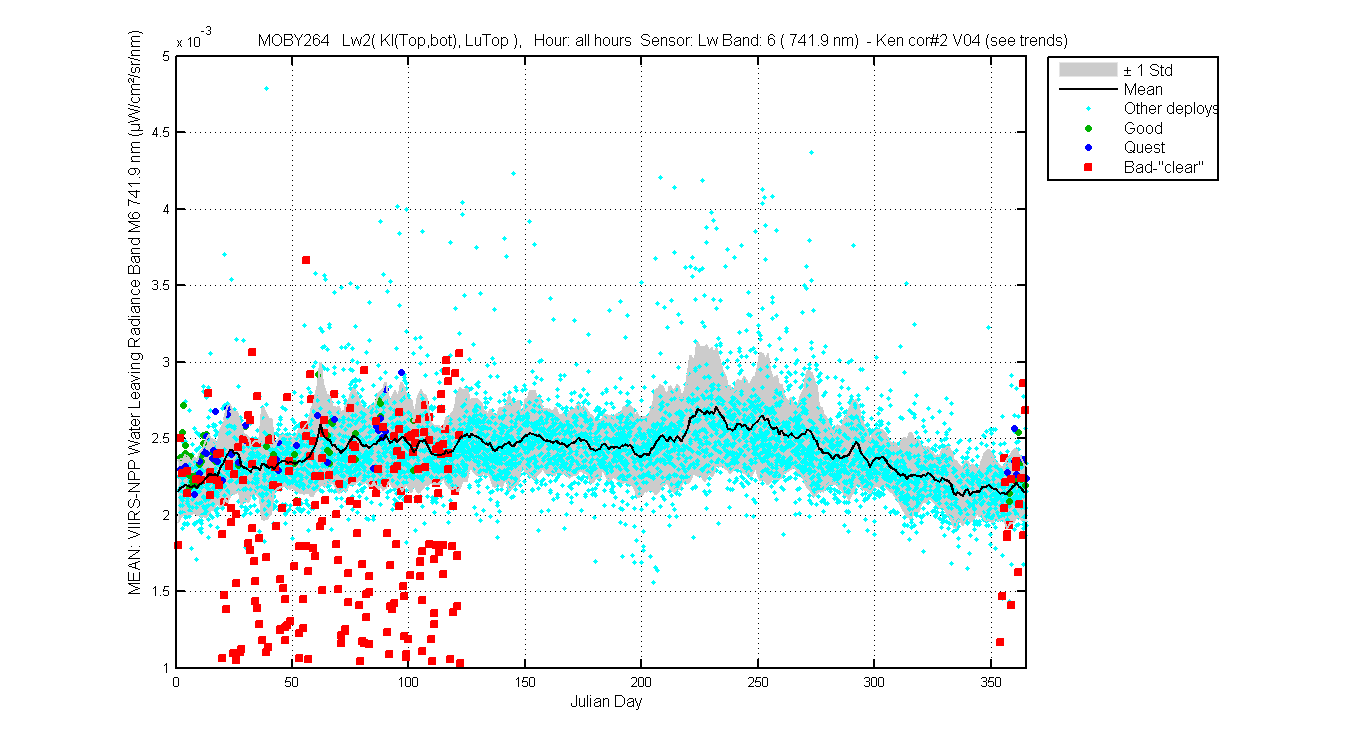
Figure 6

Figure 7
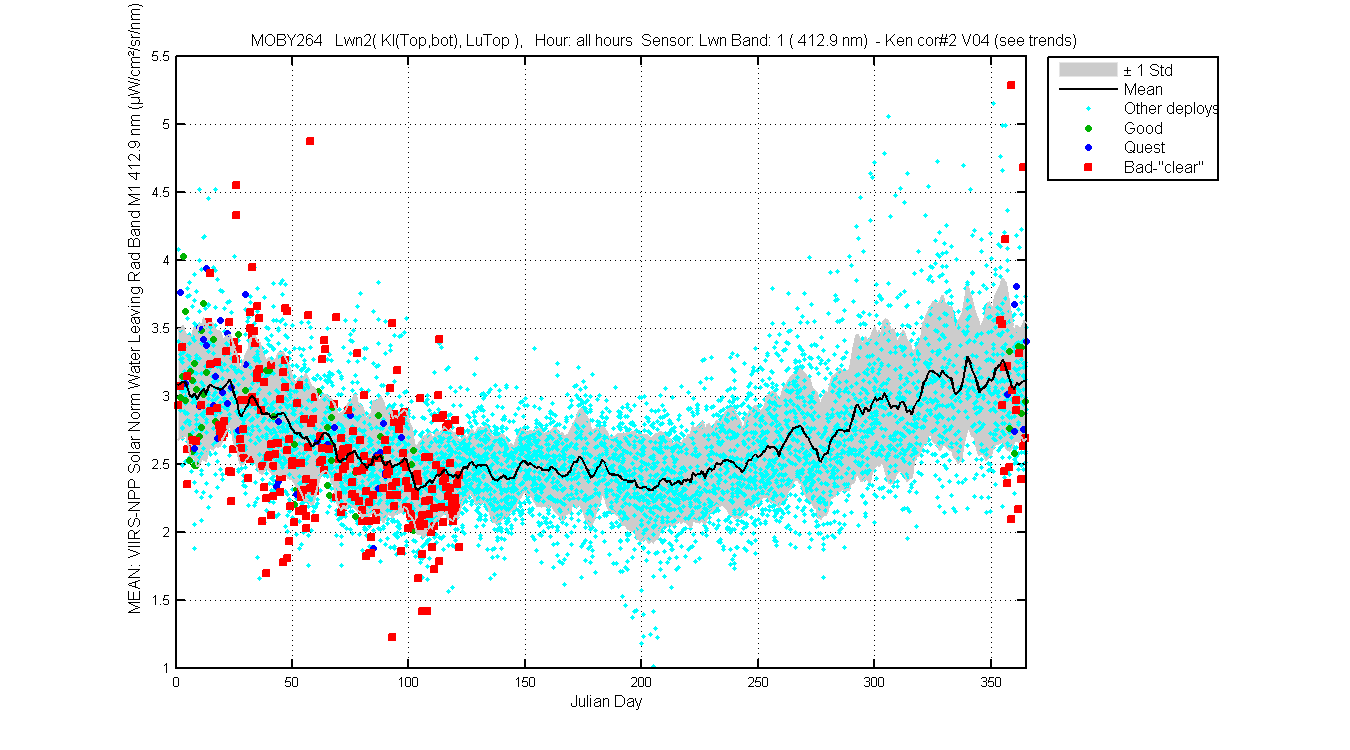
Figure 1

Figure 2
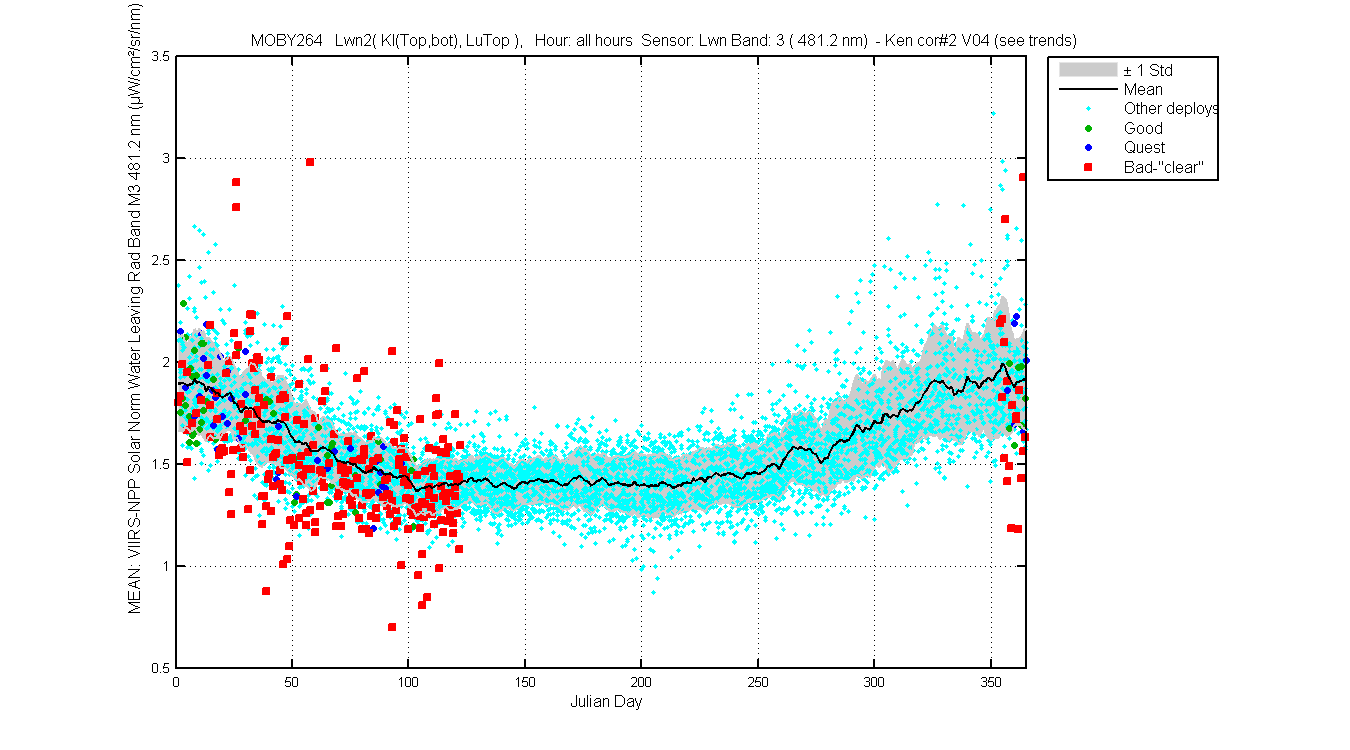
Figure 3
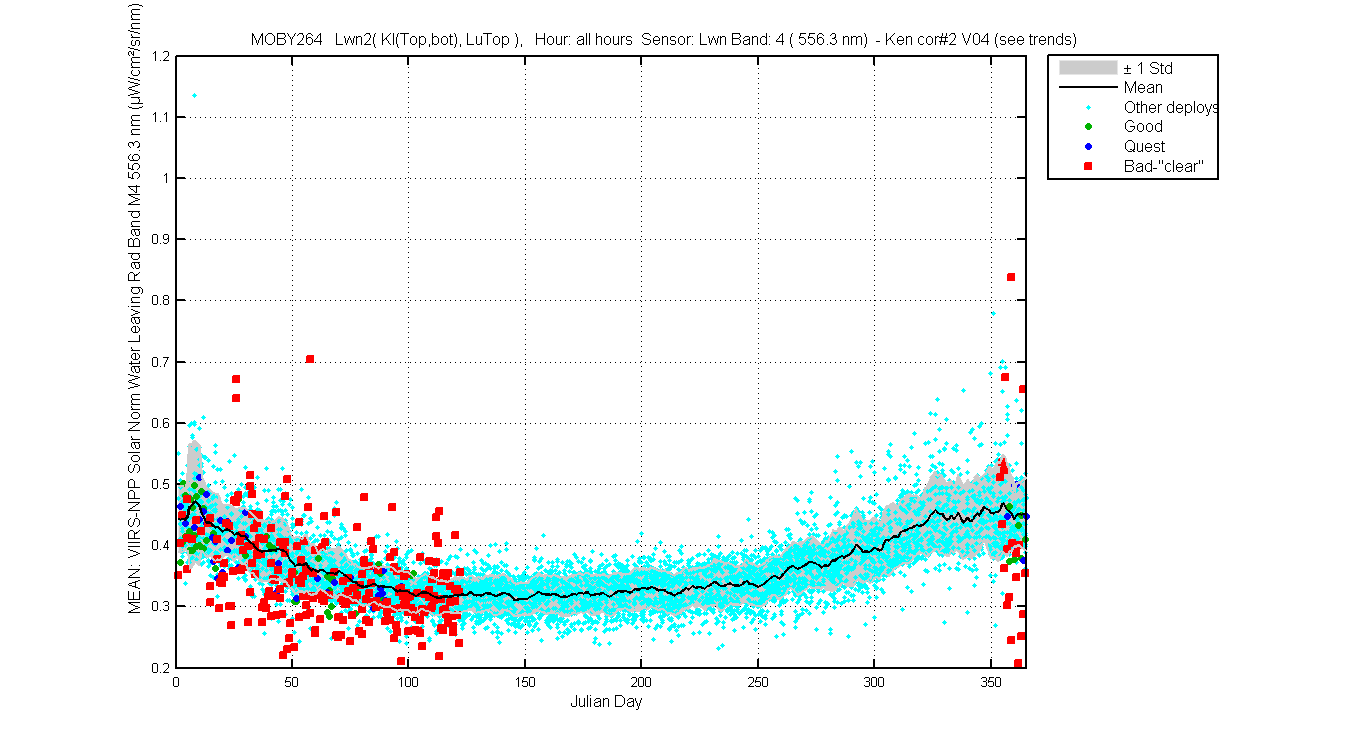
Figure 4
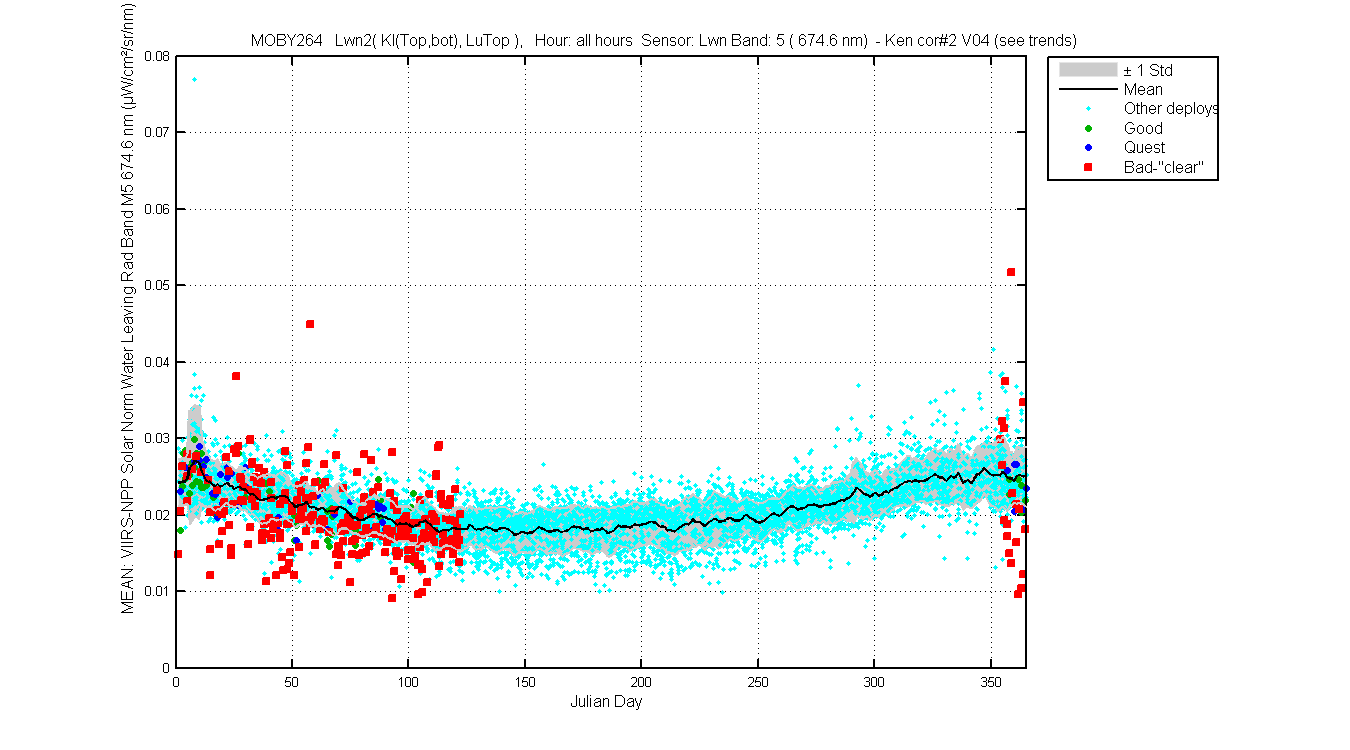
Figure 5
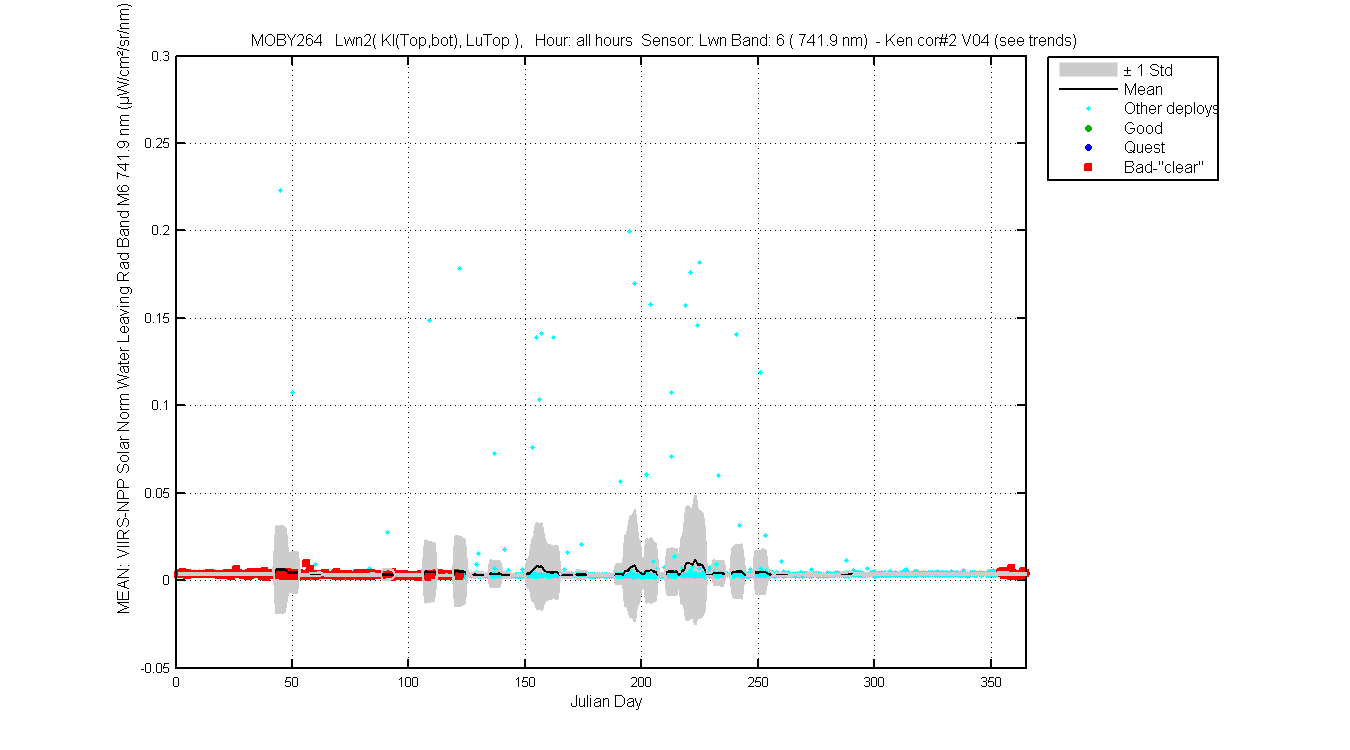
Figure 6

Figure 7

Figure 1
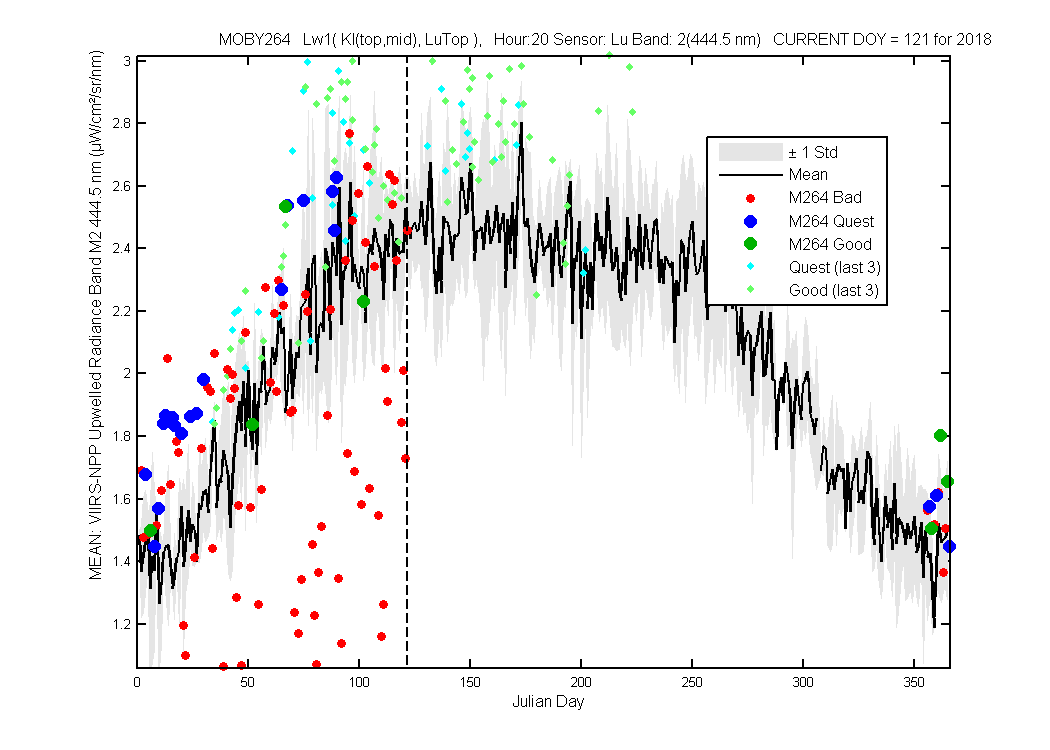
Figure 2
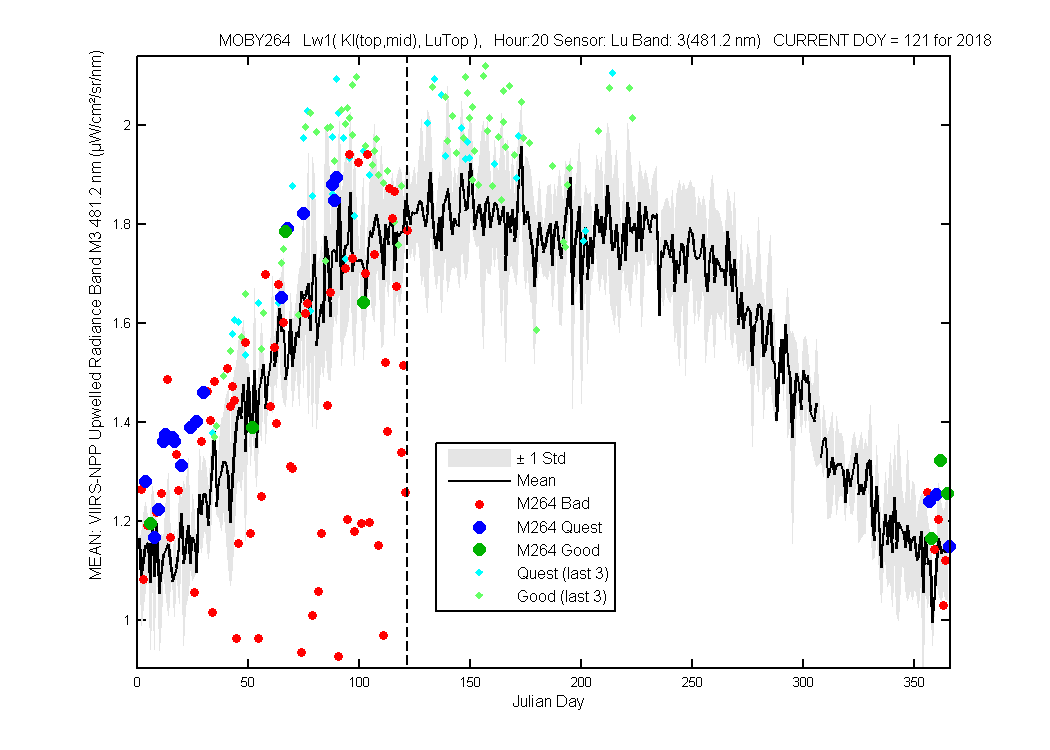
Figure 3
Figure 4
Figure 5
Figure 6
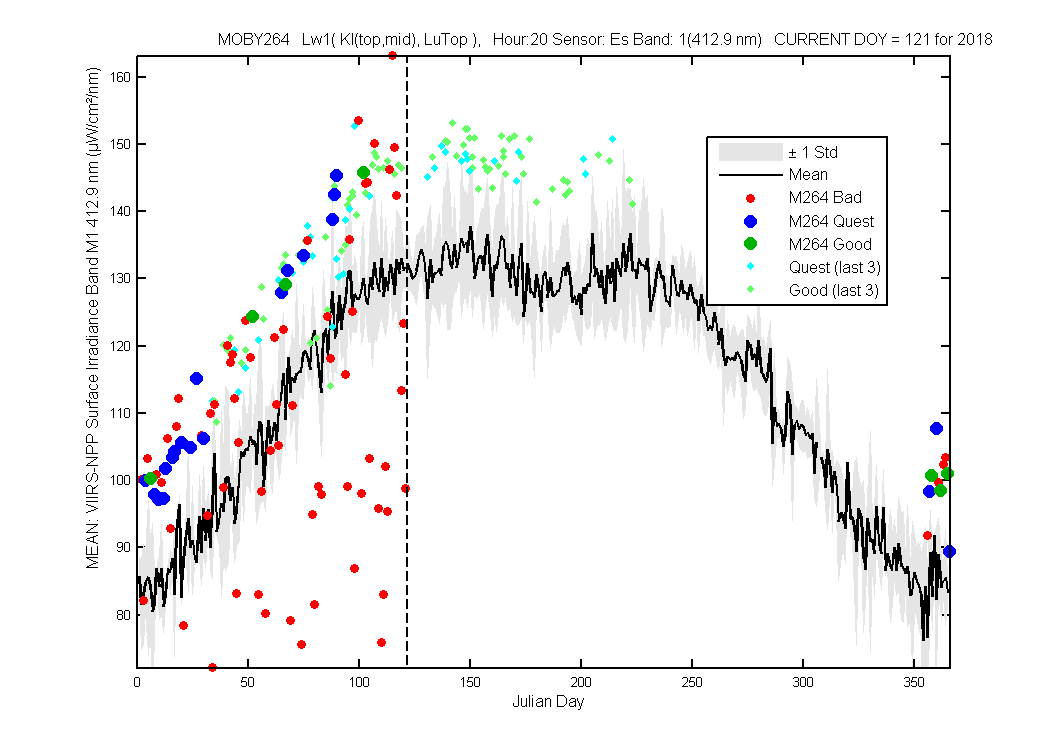
Figure 1
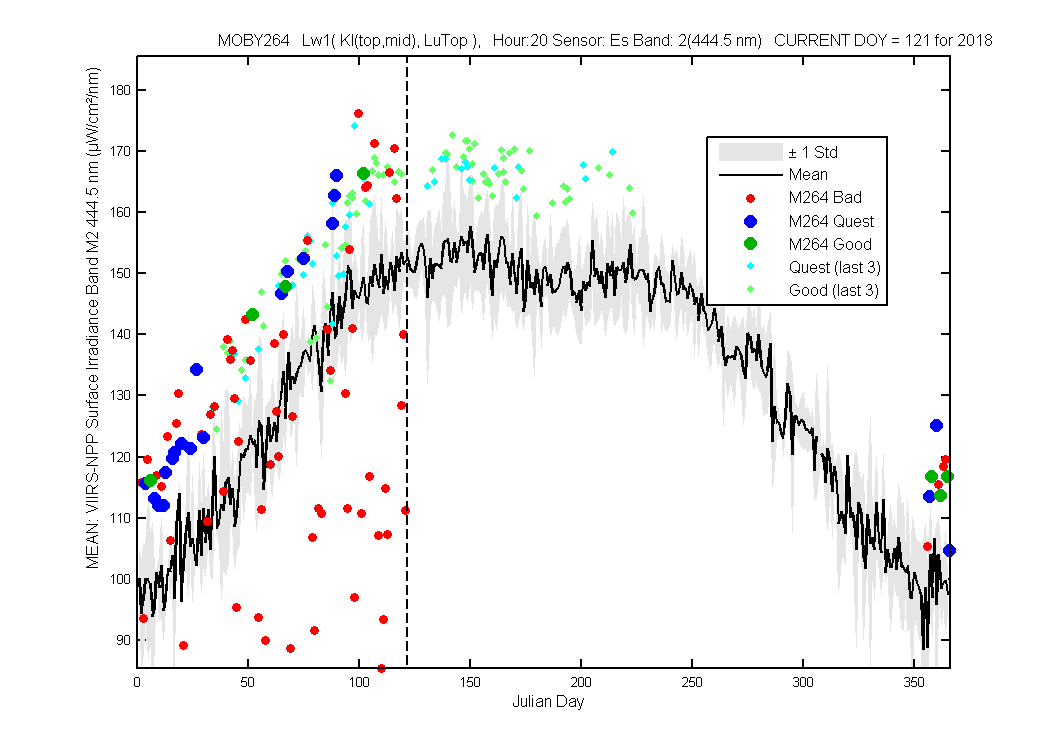
Figure 2
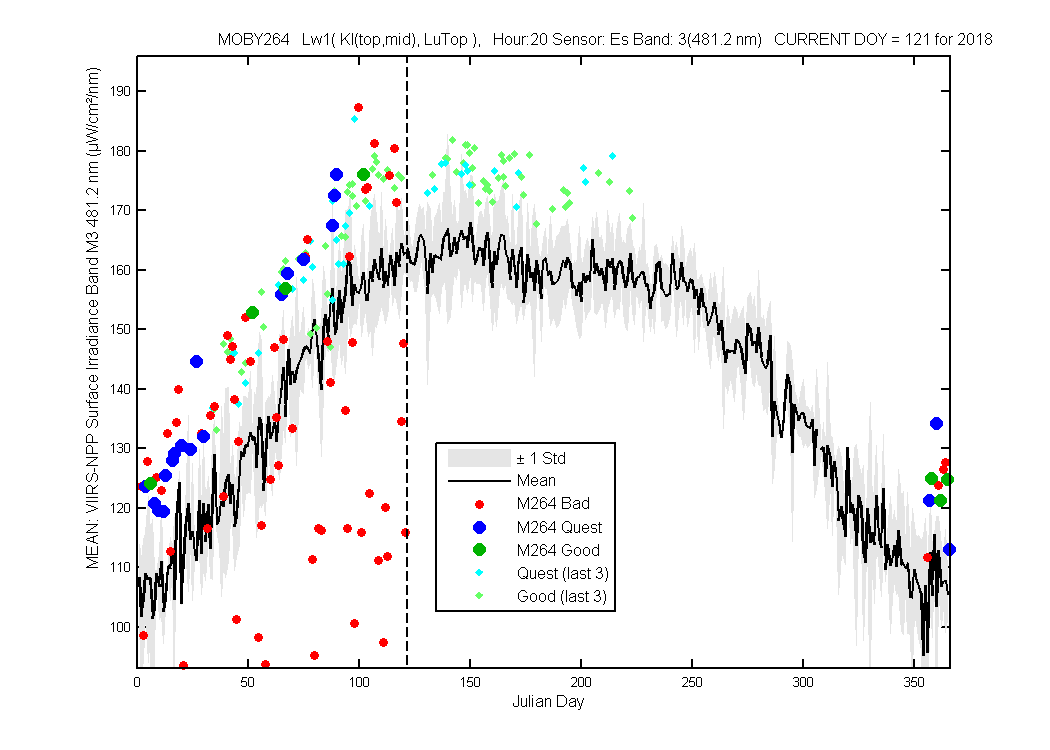
Figure 3
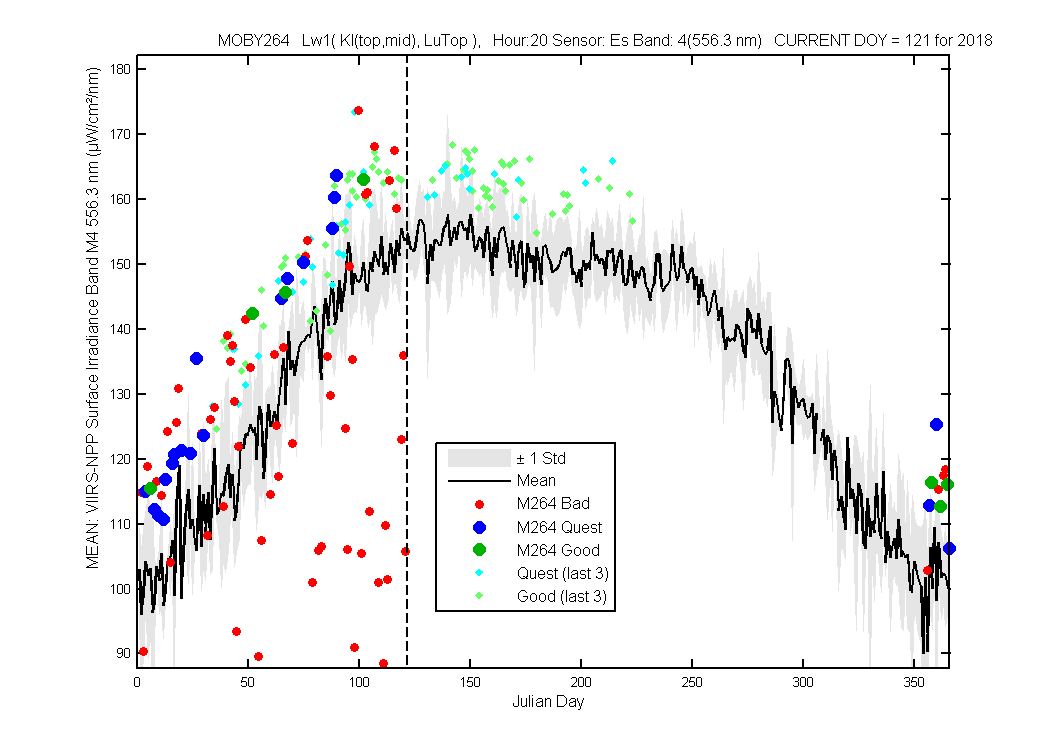
Figure 4
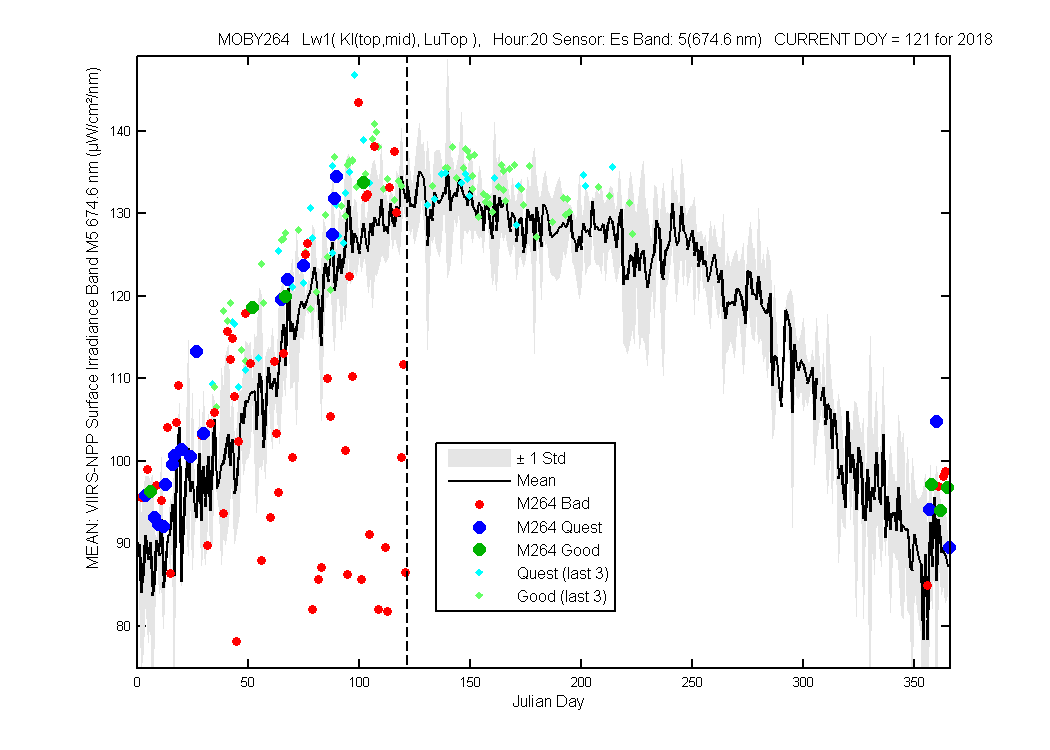
Figure 5

Figure 6
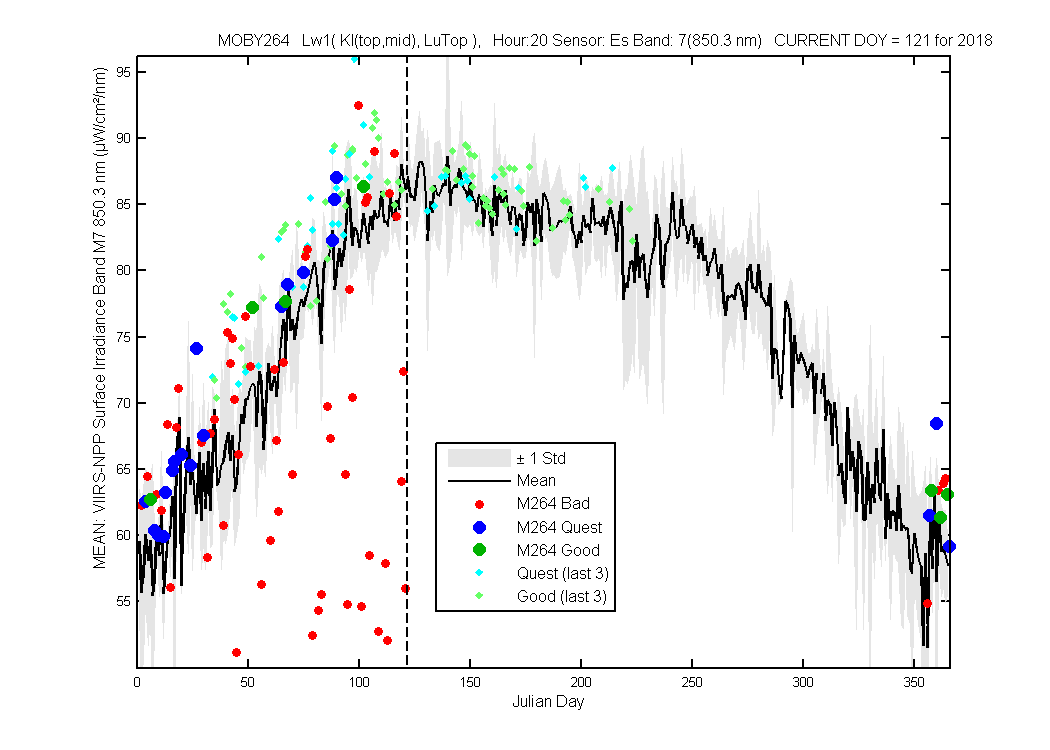
Figure 7
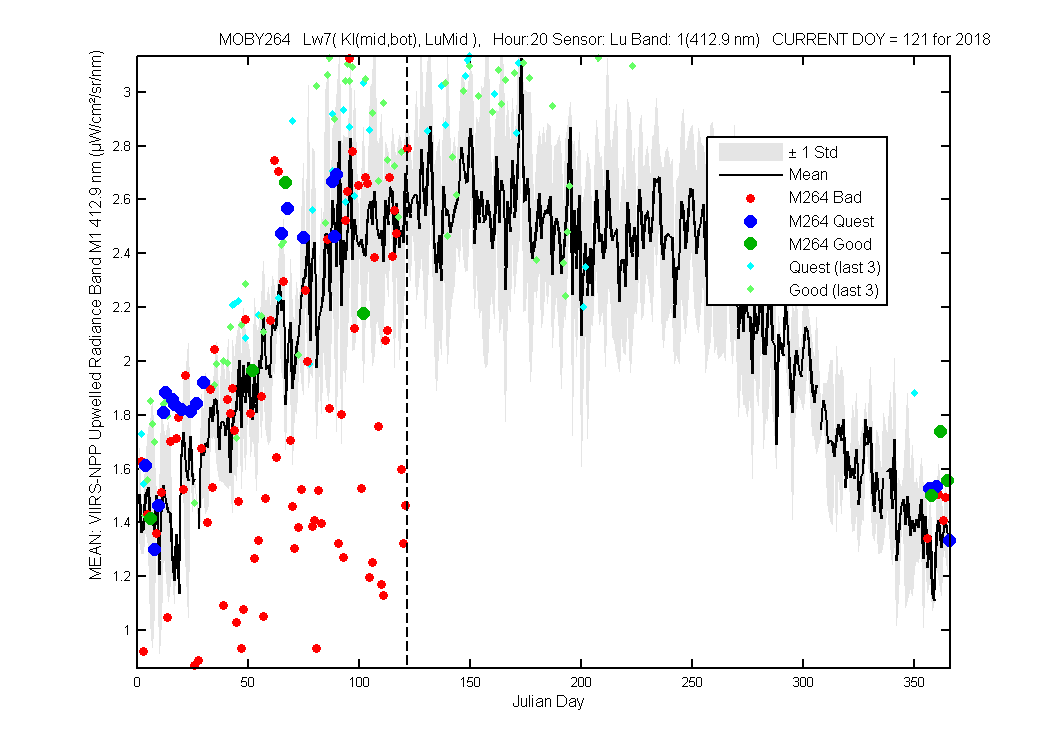
Figure 1
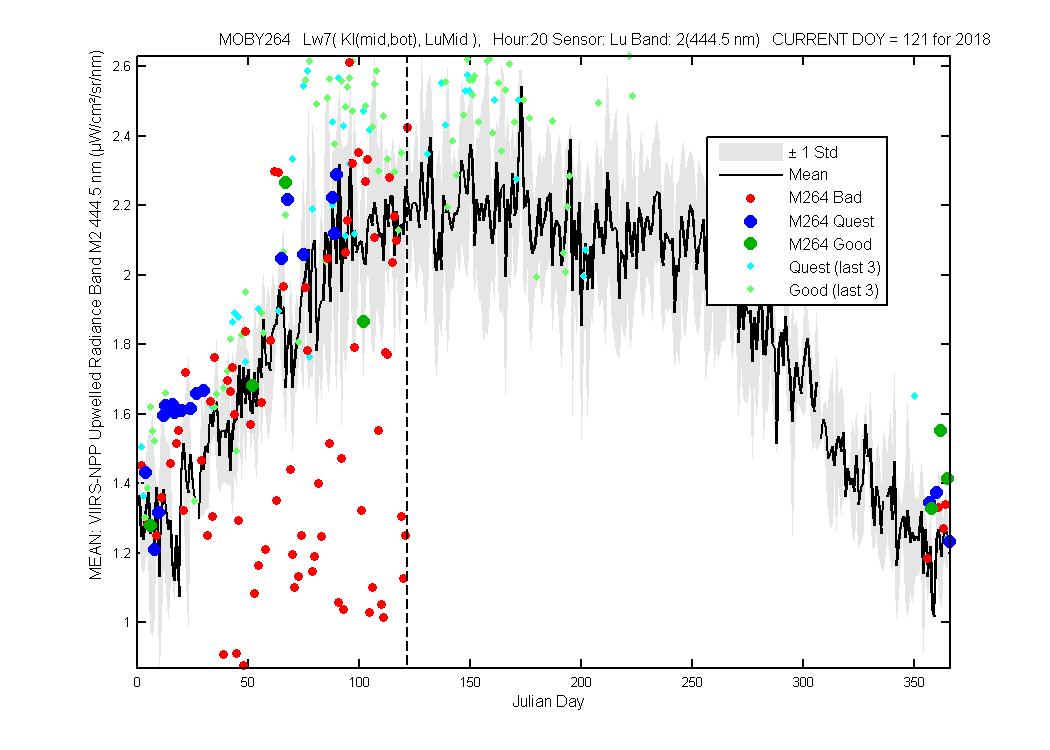
Figure 2
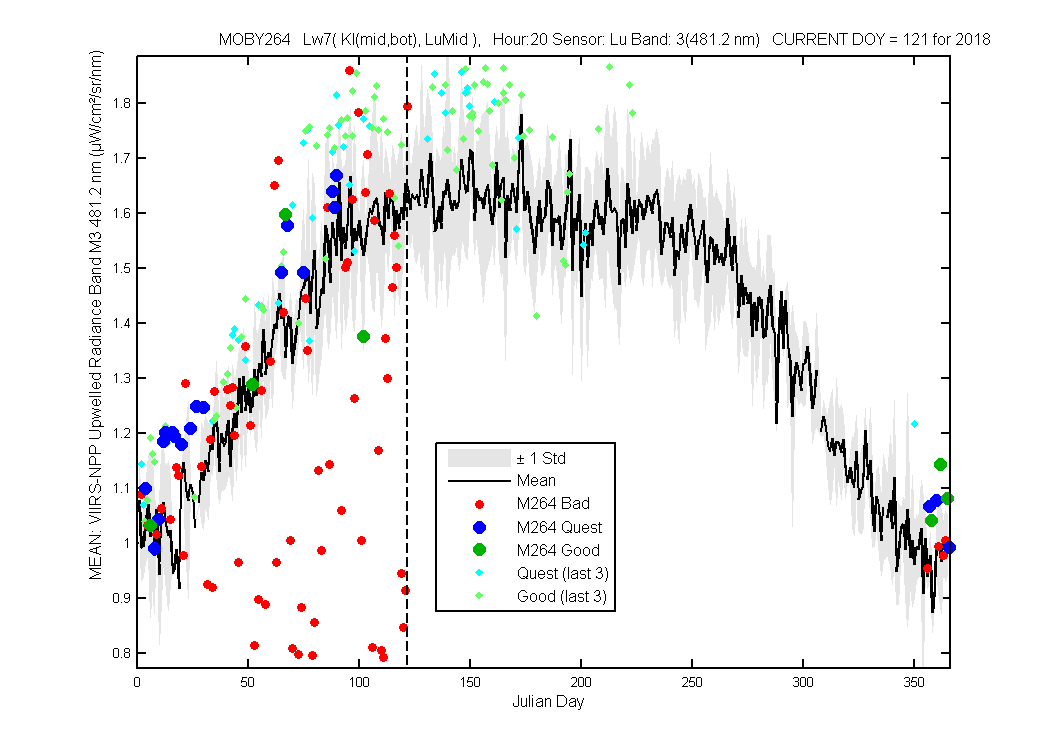
Figure 3
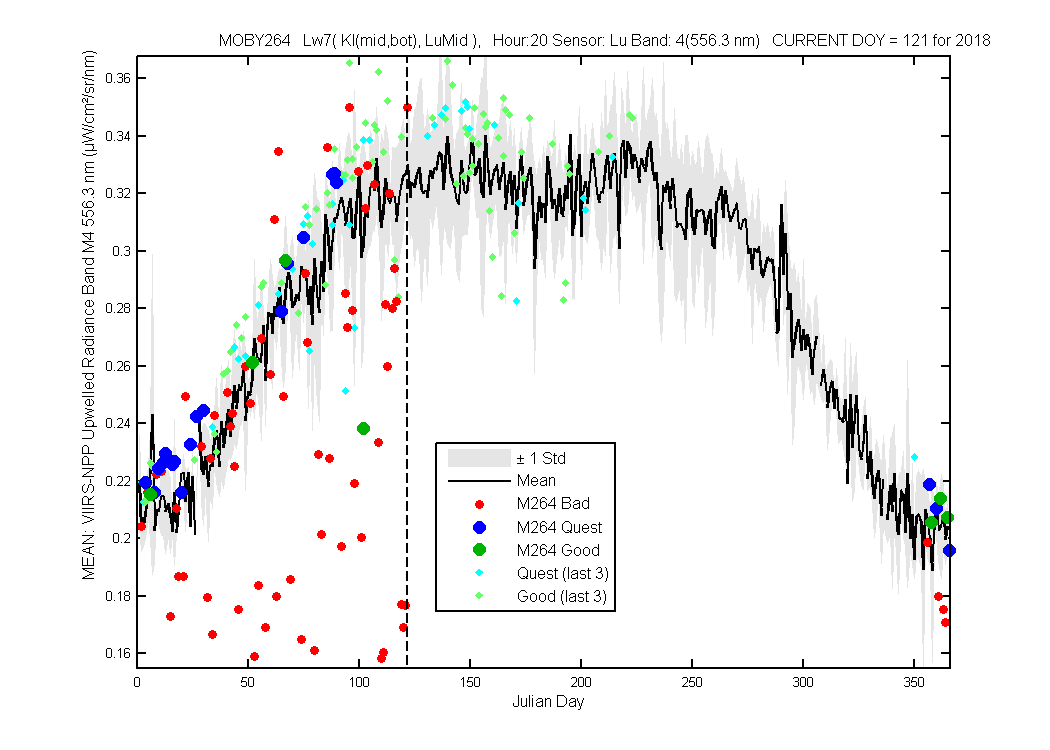
Figure 4
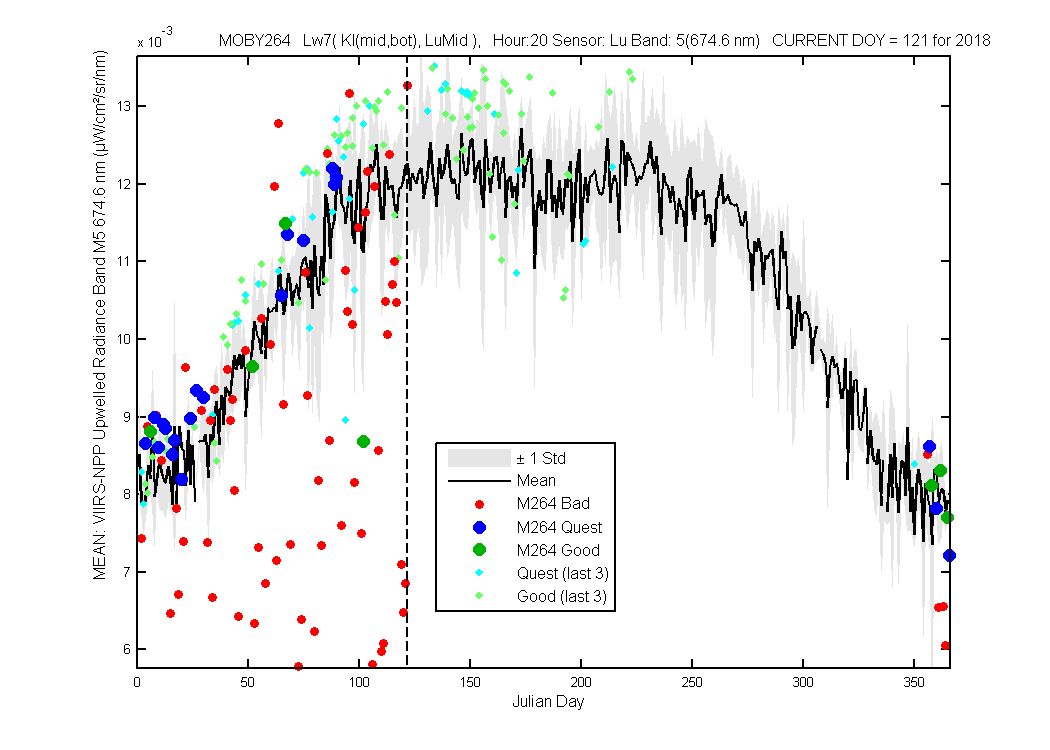
Figure 5
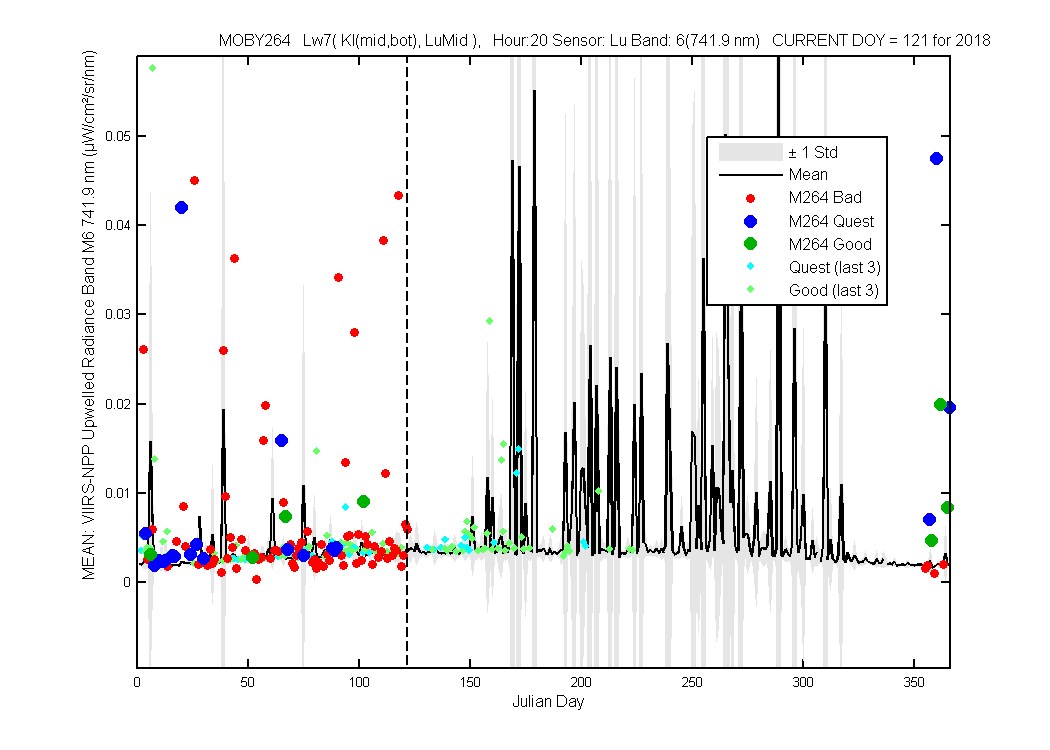
Figure 6
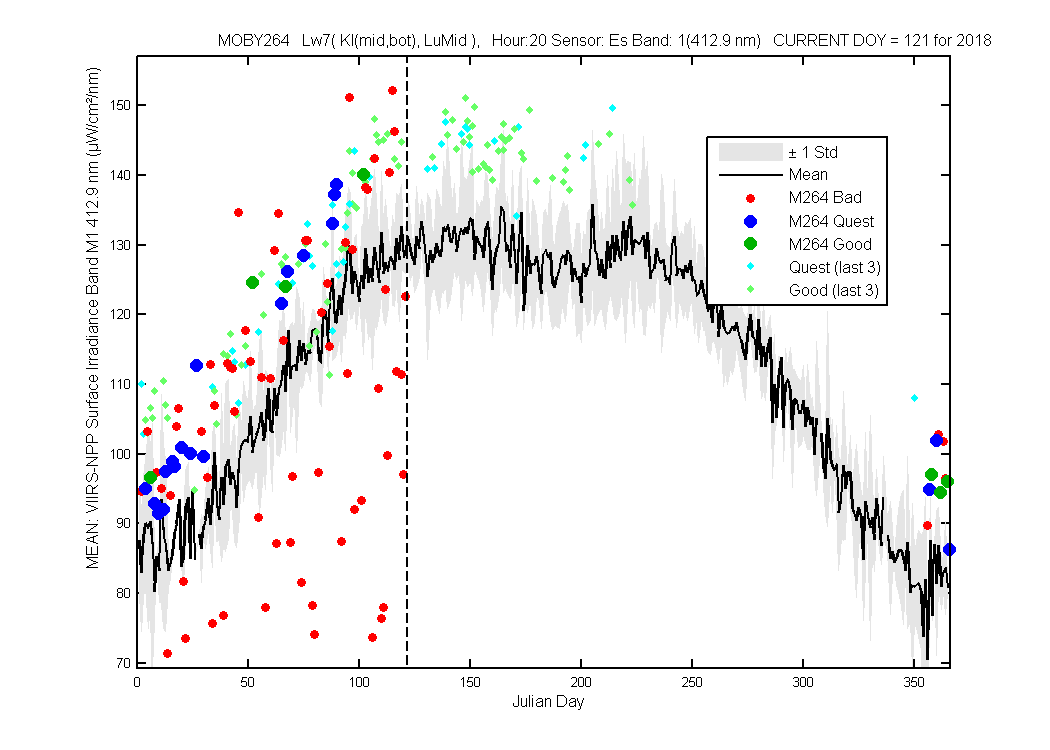
Figure 1
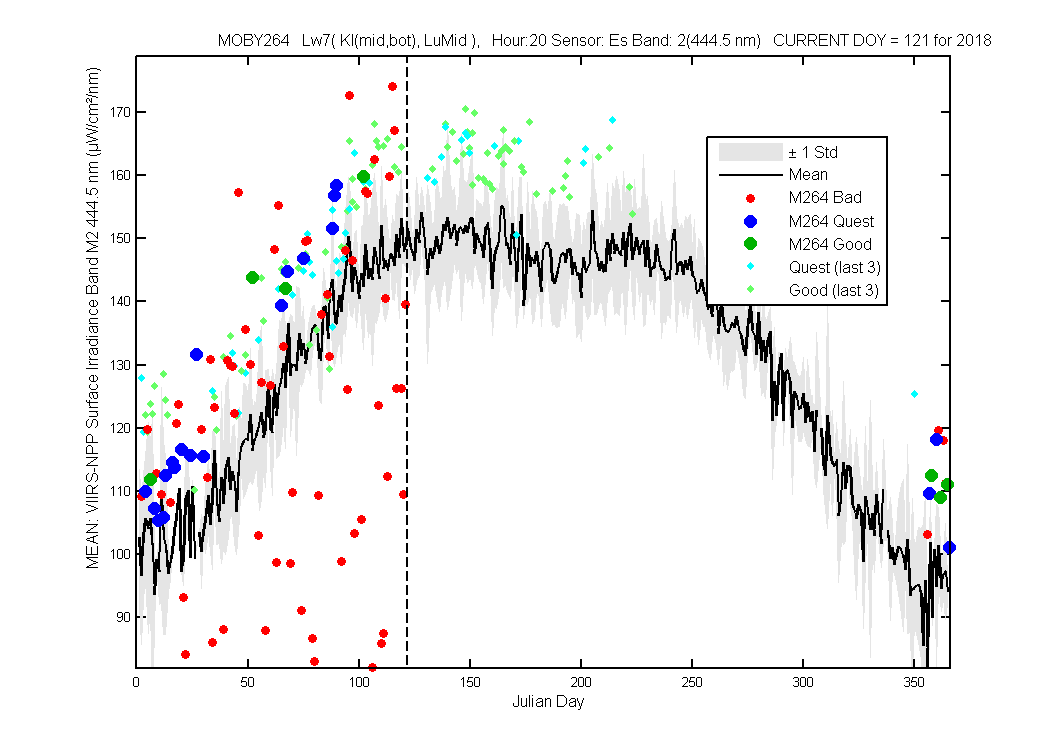
Figure 2

Figure 3
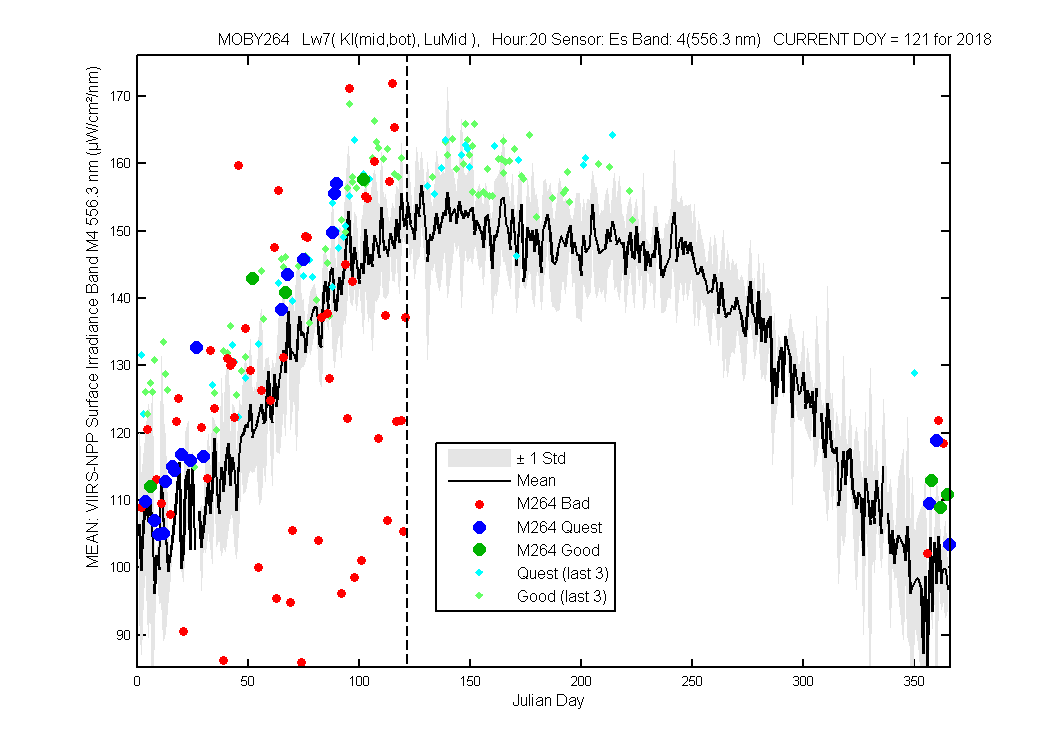
Figure 4
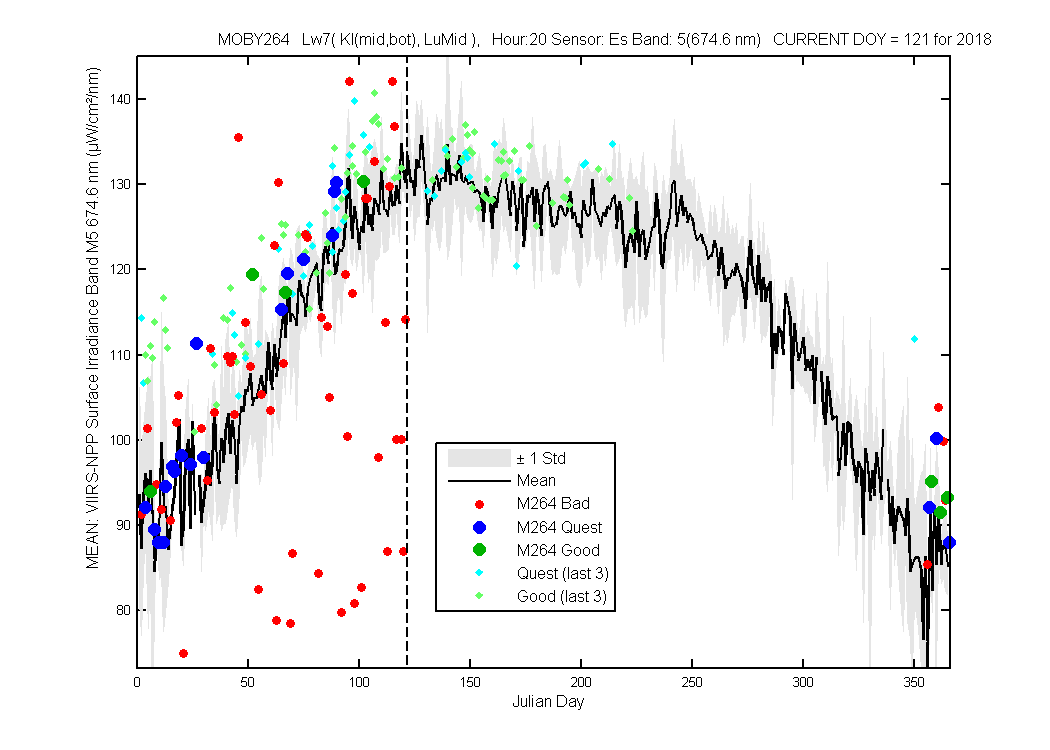
Figure 5
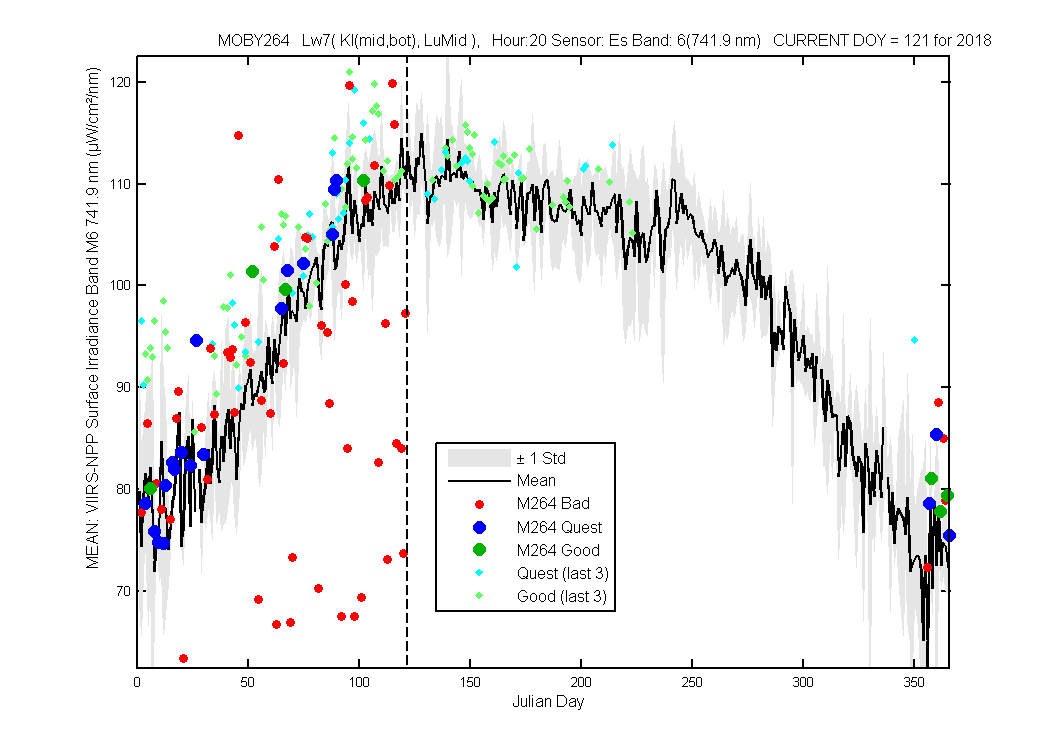
Figure 6
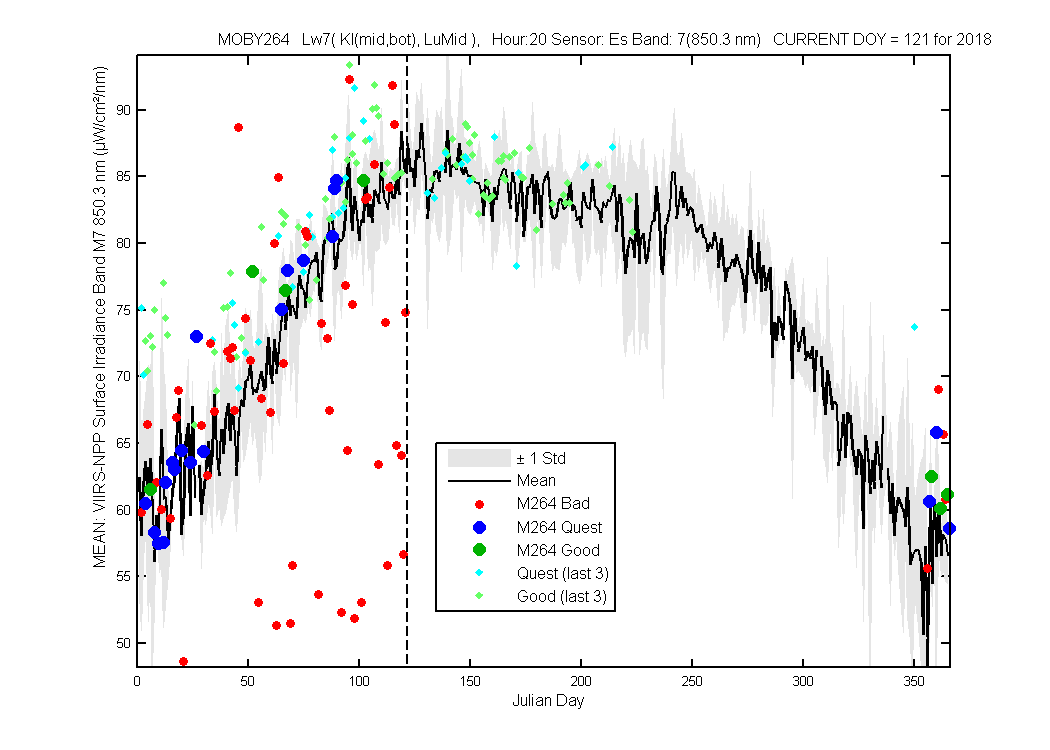
Figure 7
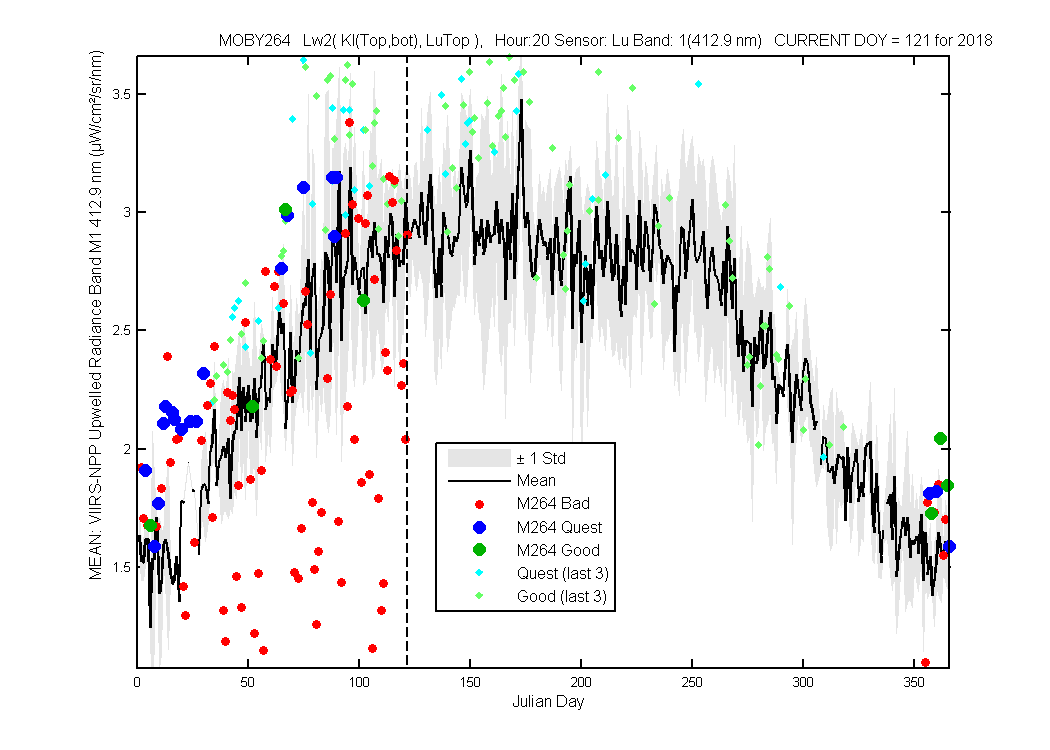
Figure 1
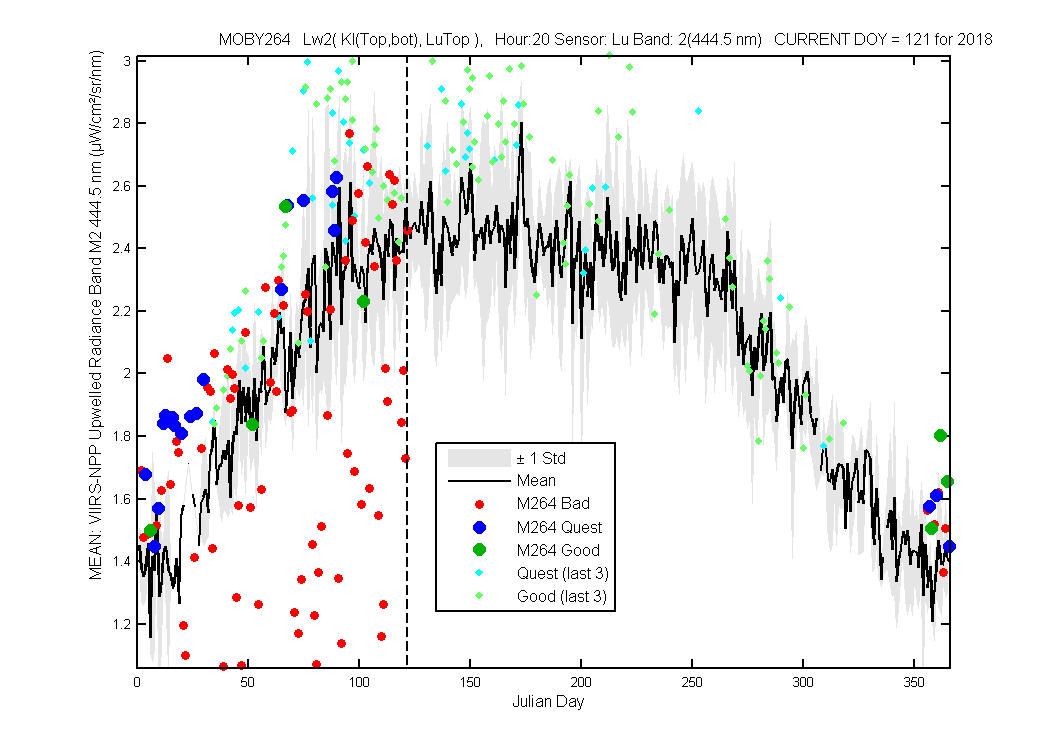
Figure 2
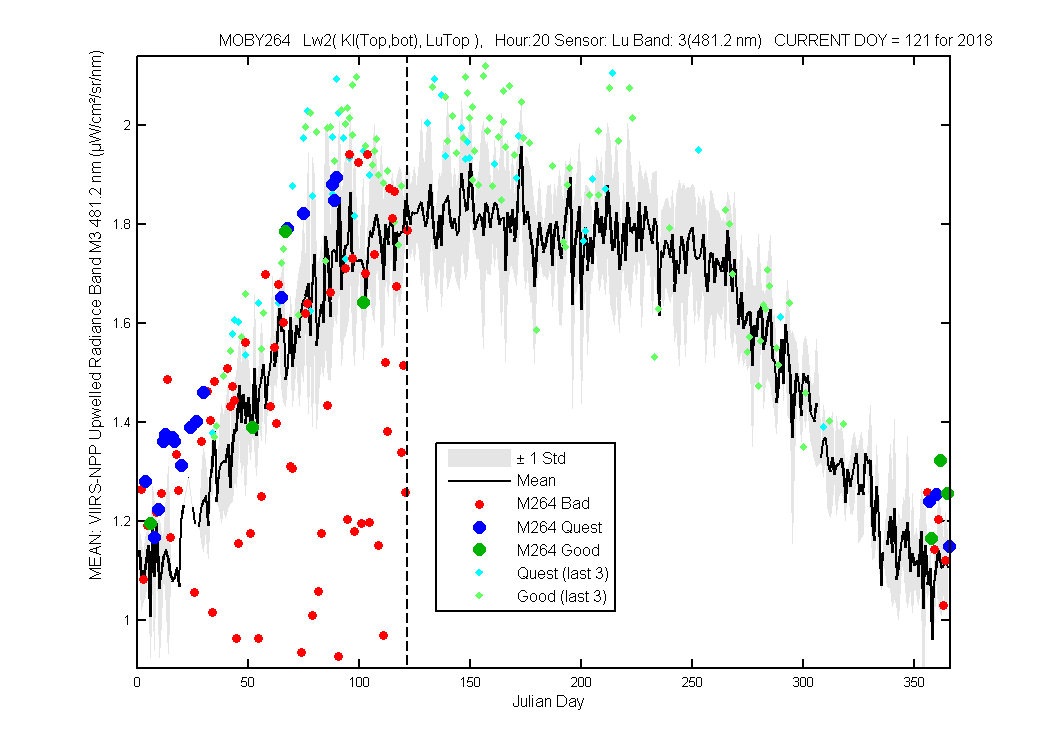
Figure 3
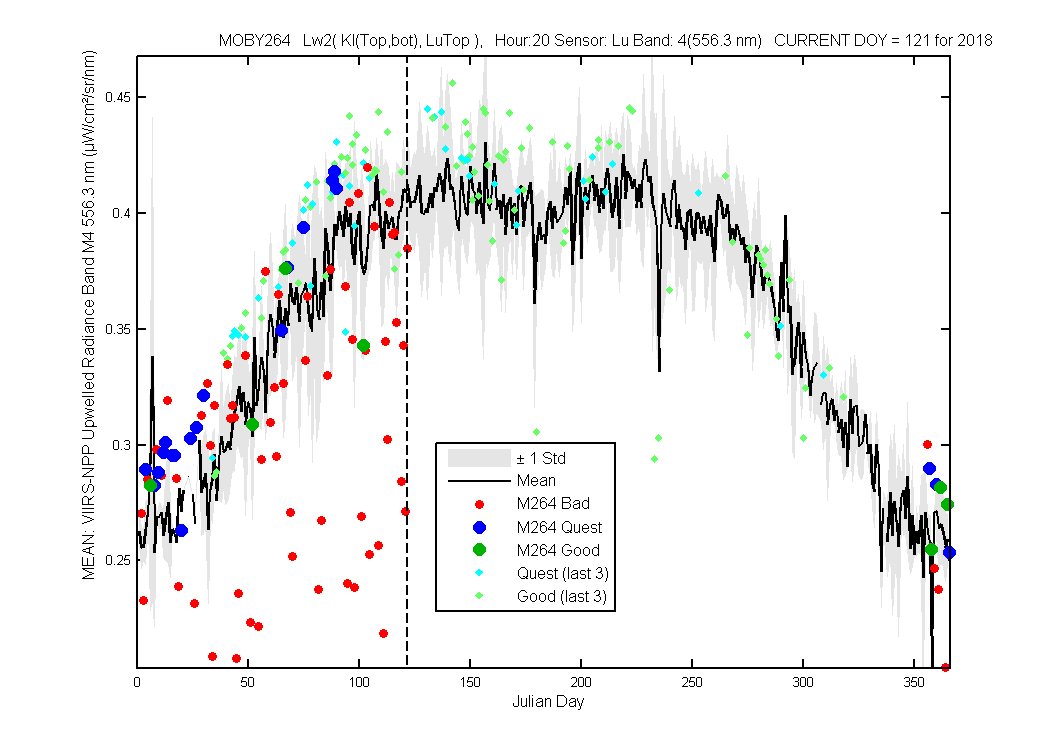
Figure 4
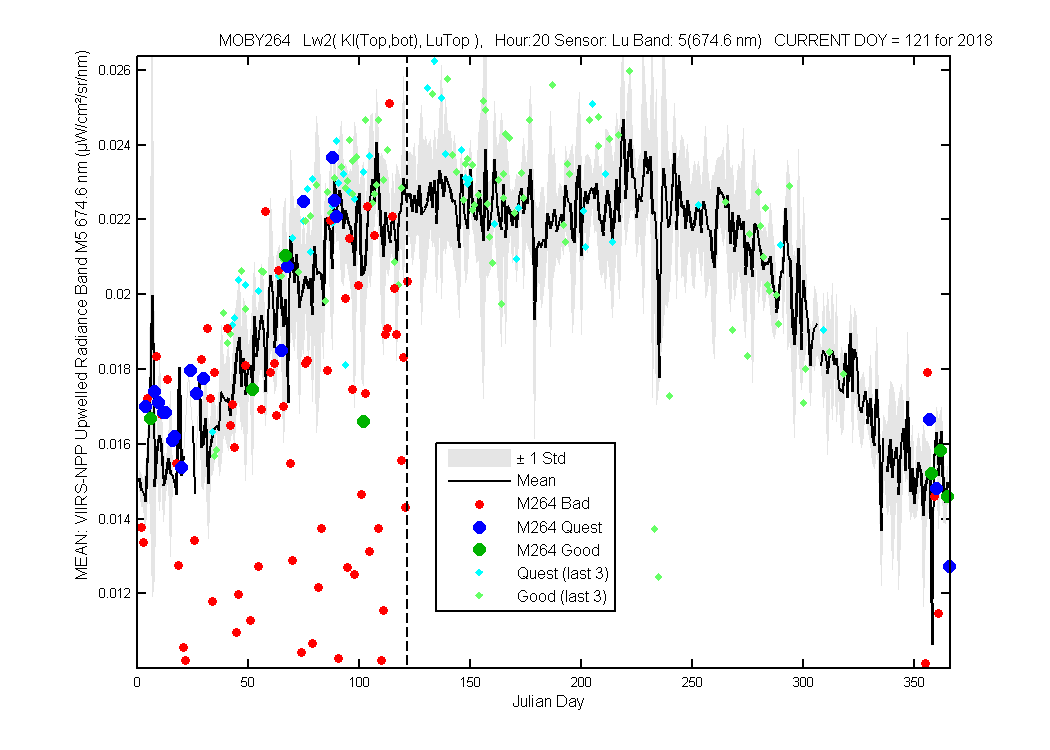
Figure 5
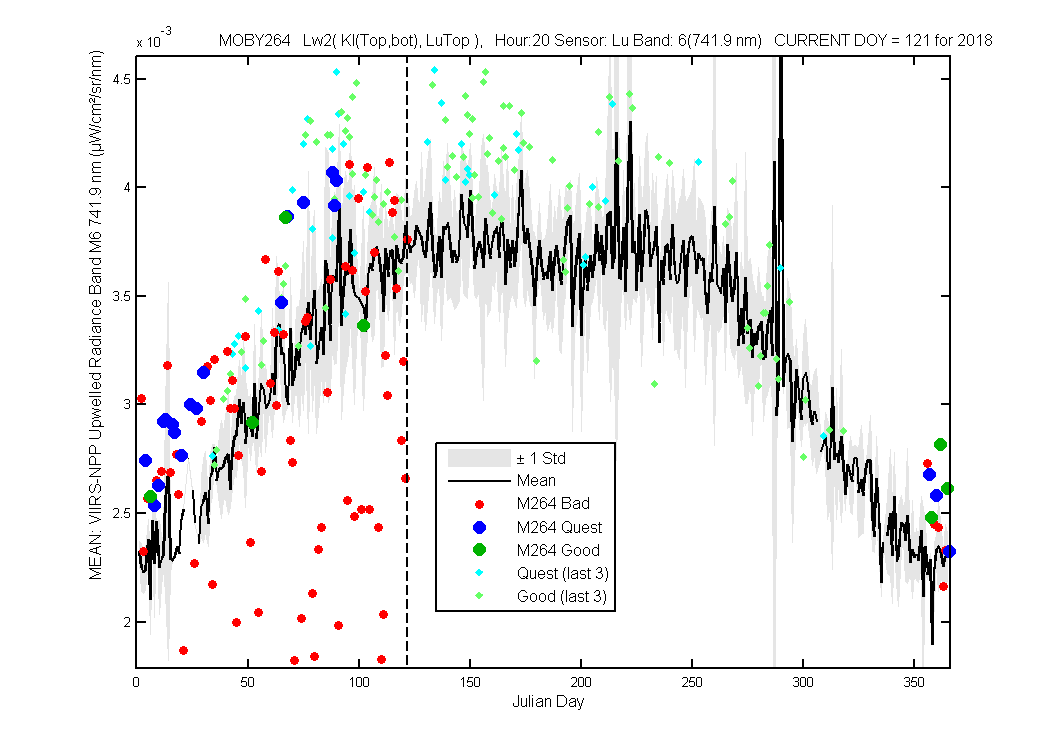
Figure 6
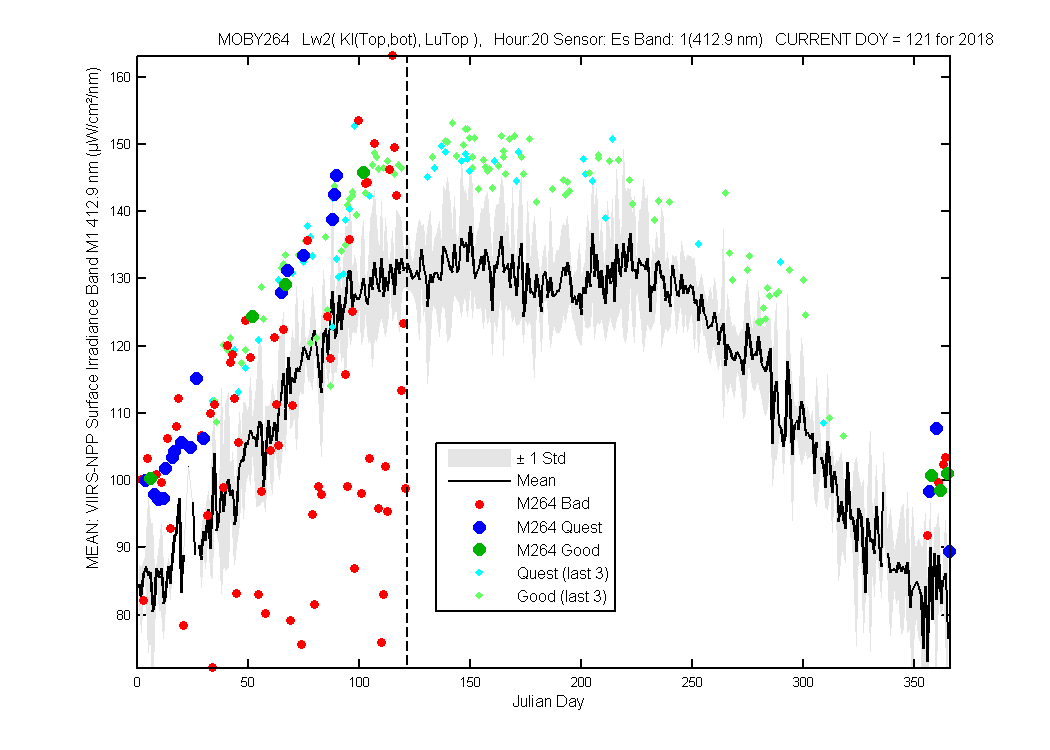
Figure 1
Figure 2
Figure 3
Figure 4
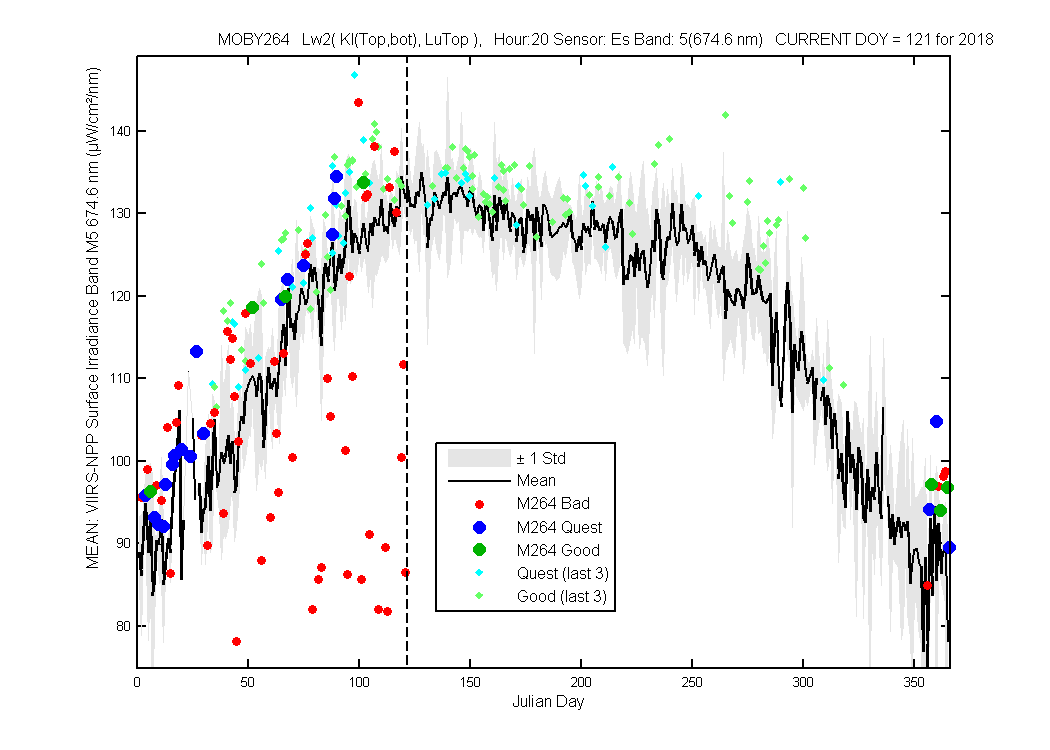
Figure 5

Figure 6
Figure 7
Figure 1
Figure 2

Figure 3
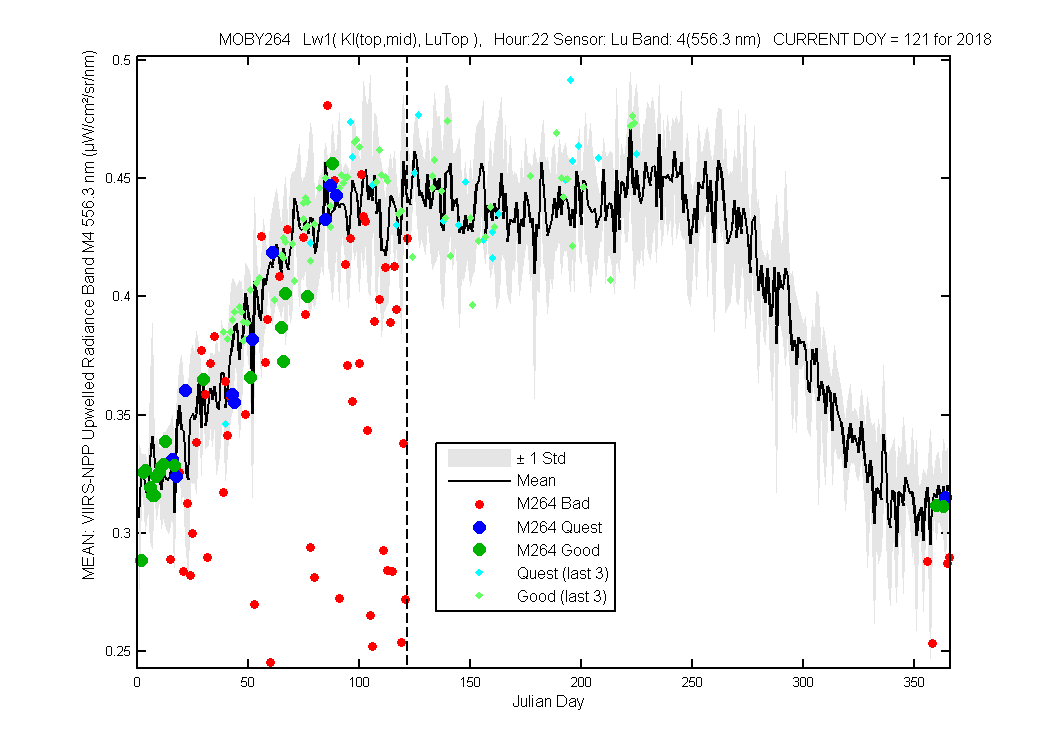
Figure 4
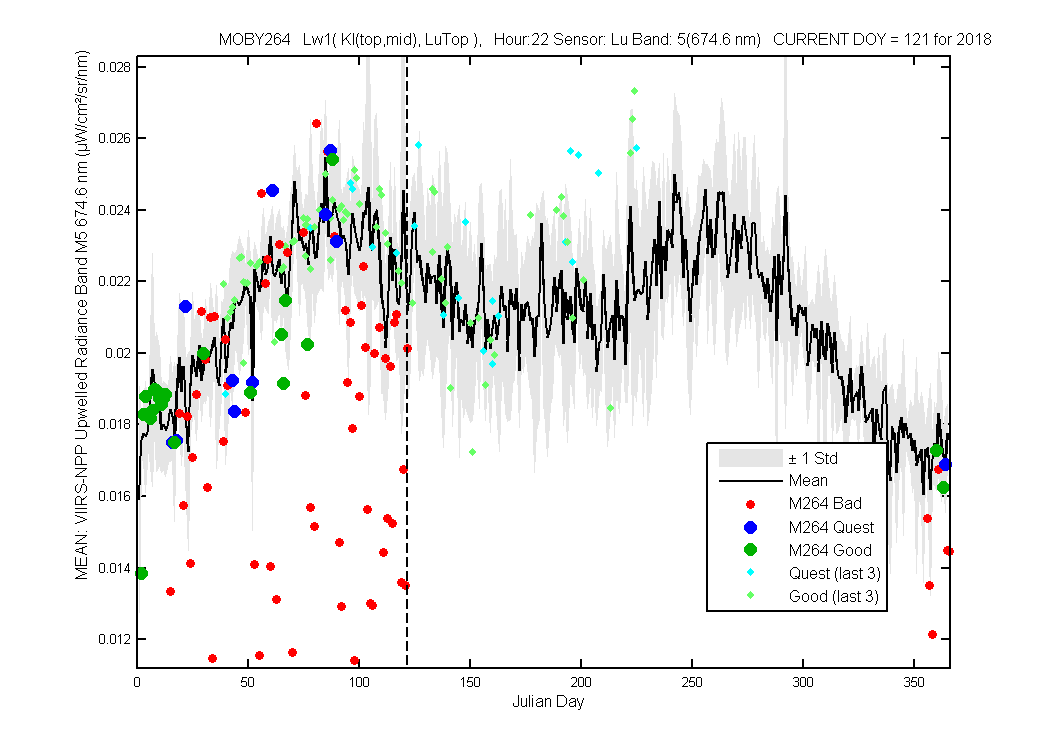
Figure 5
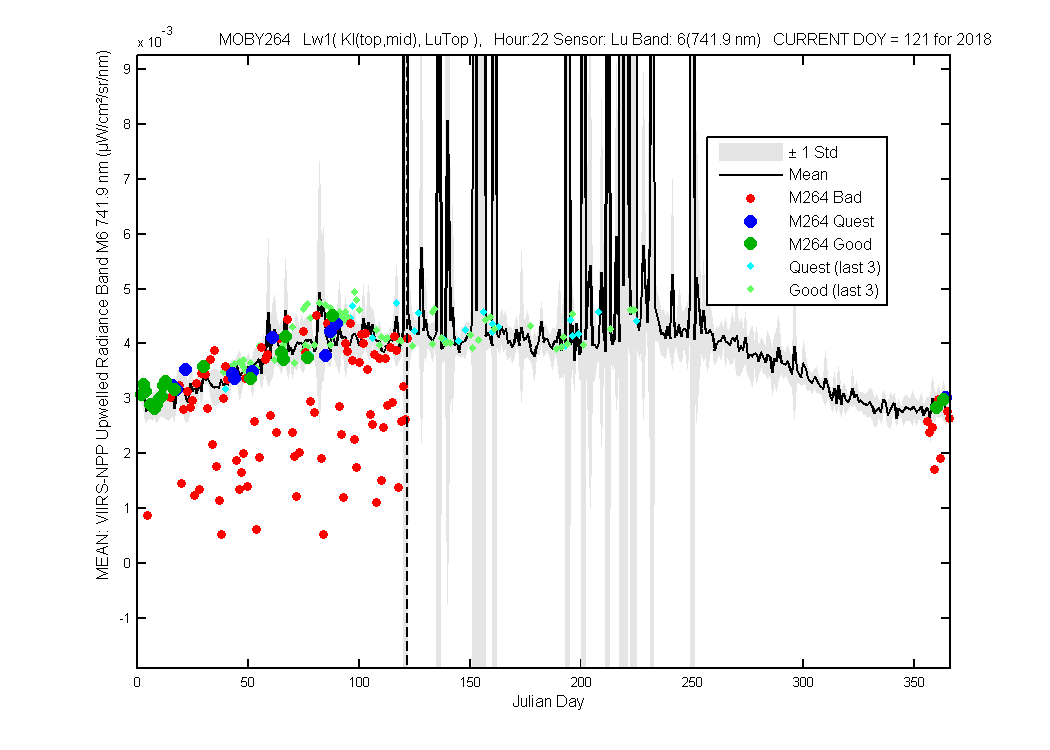
Figure 6
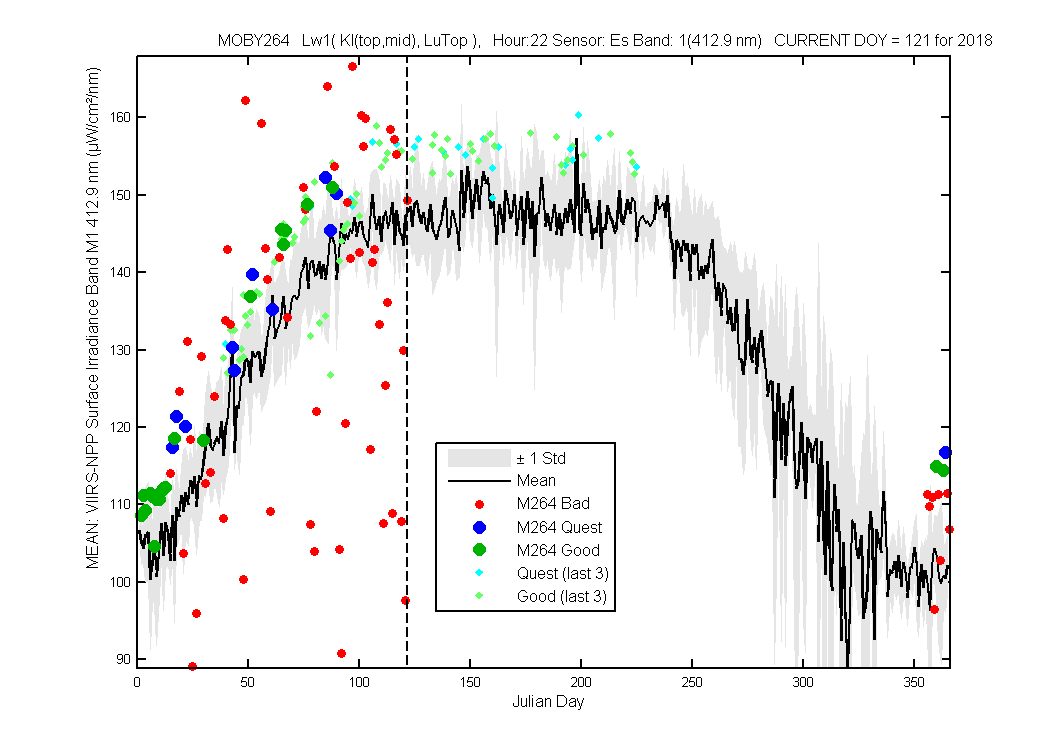
Figure 1
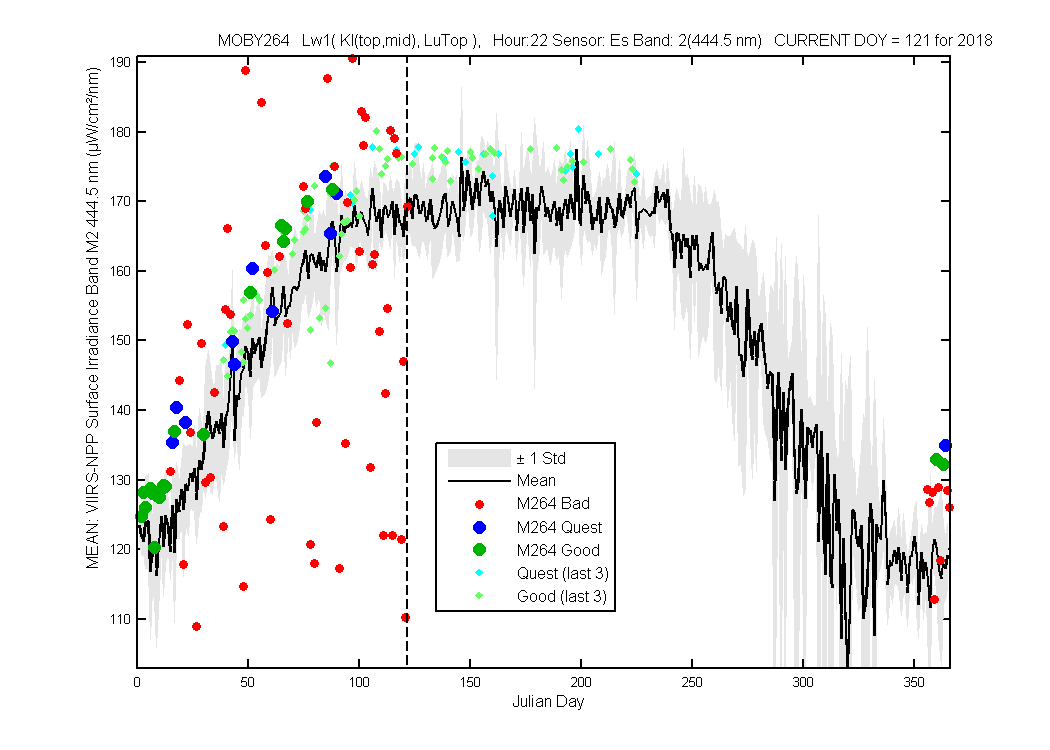
Figure 2
Figure 3
Figure 4
Figure 5
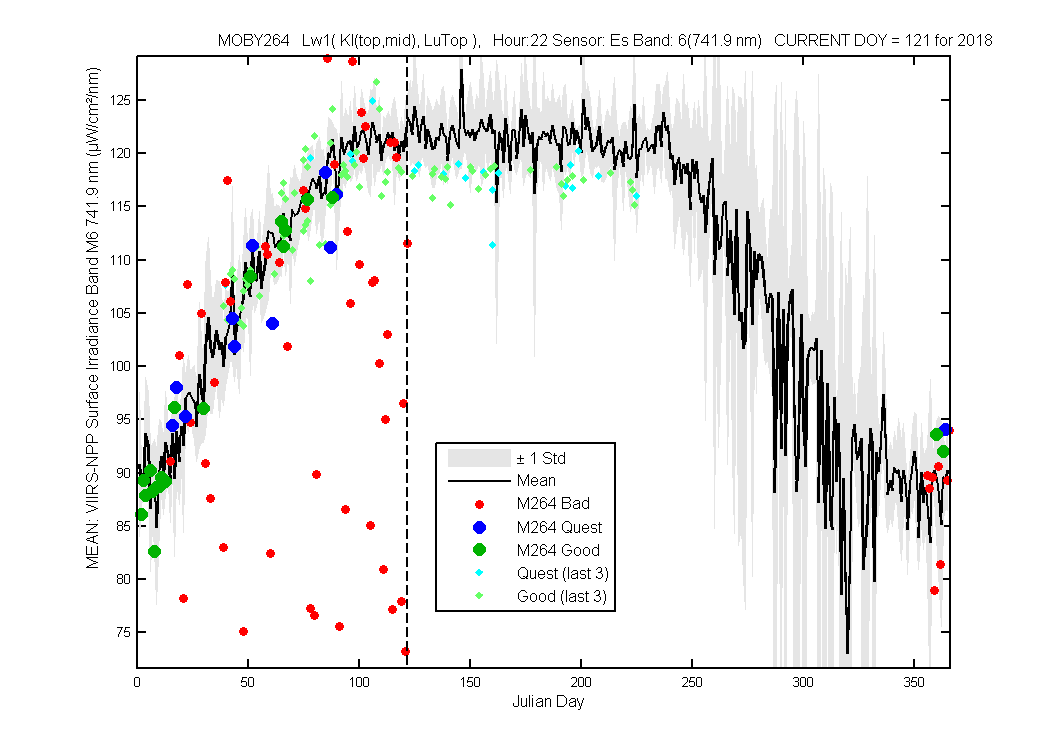
Figure 6

Figure 7
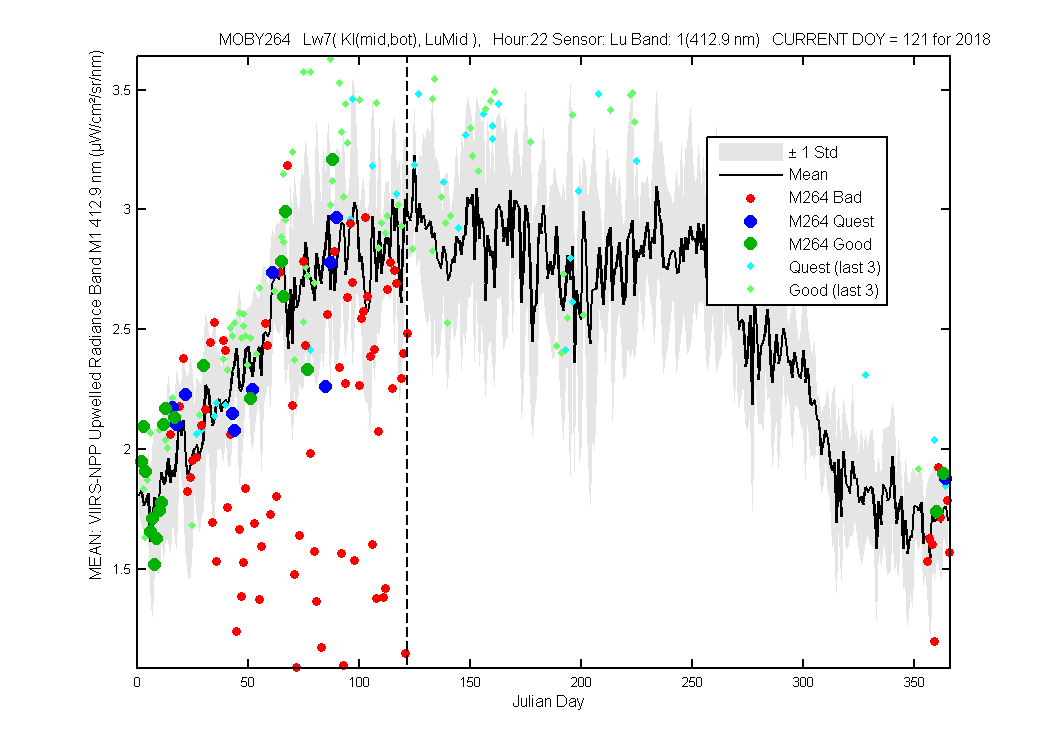
Figure 1
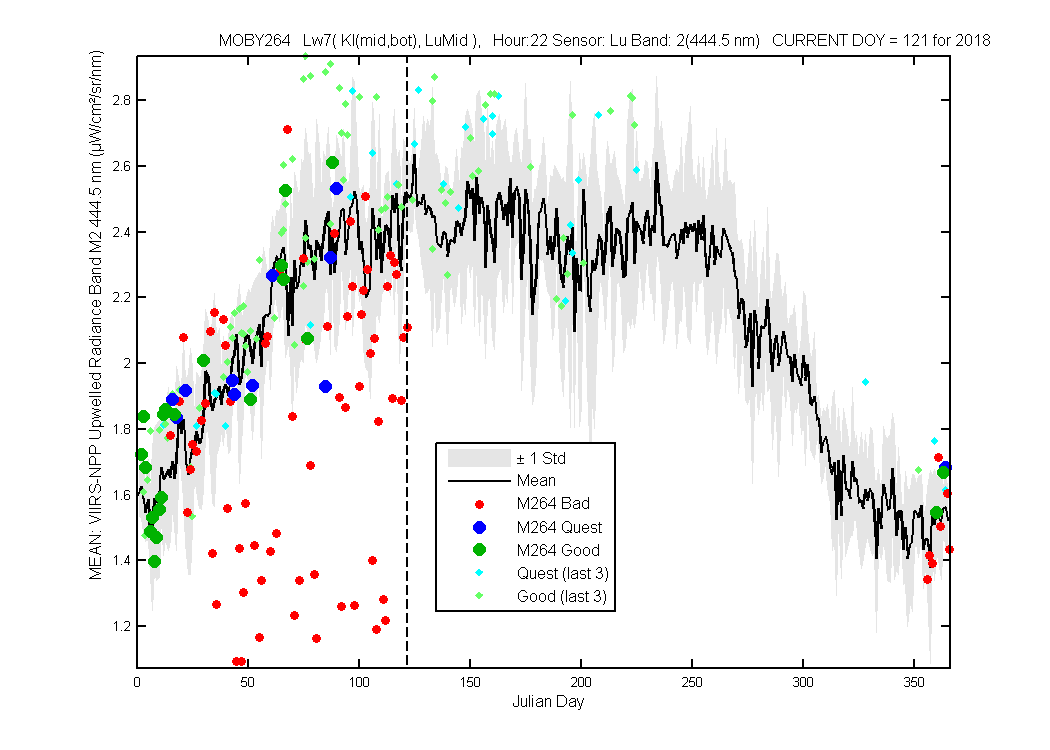
Figure 2
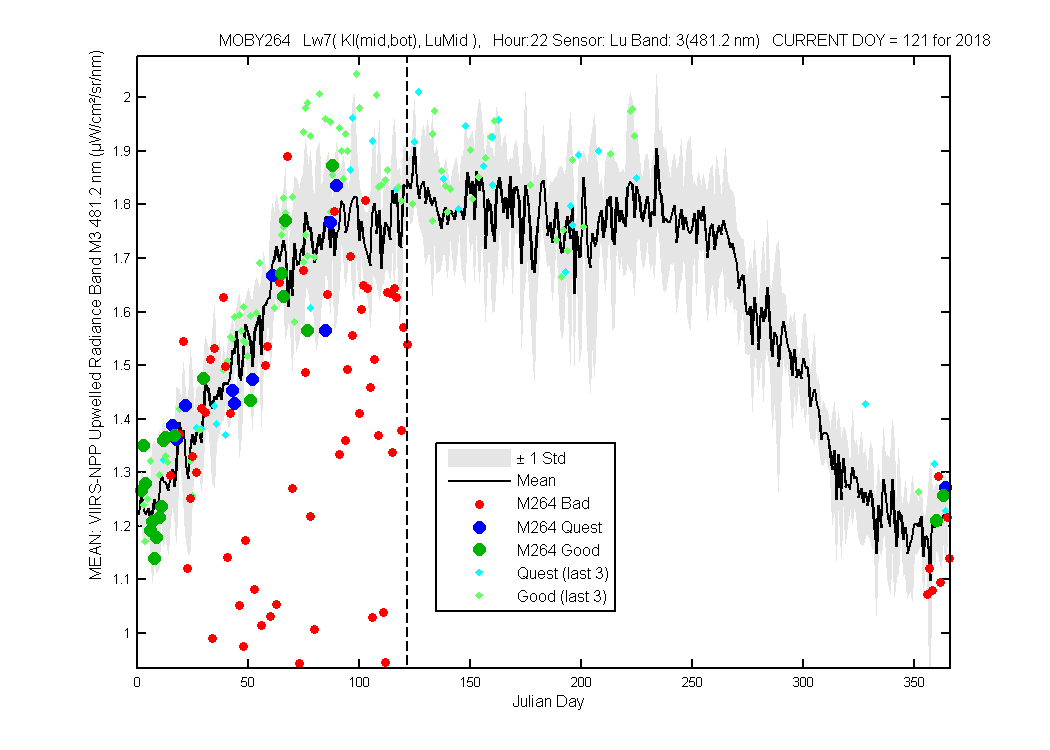
Figure 3
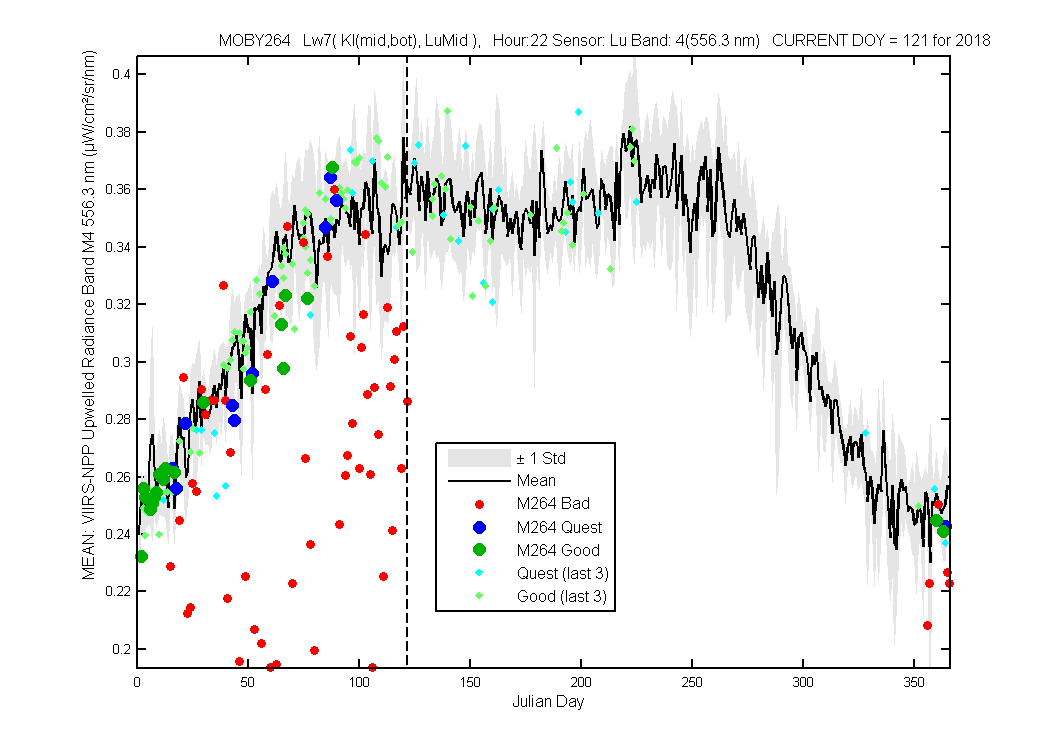
Figure 4
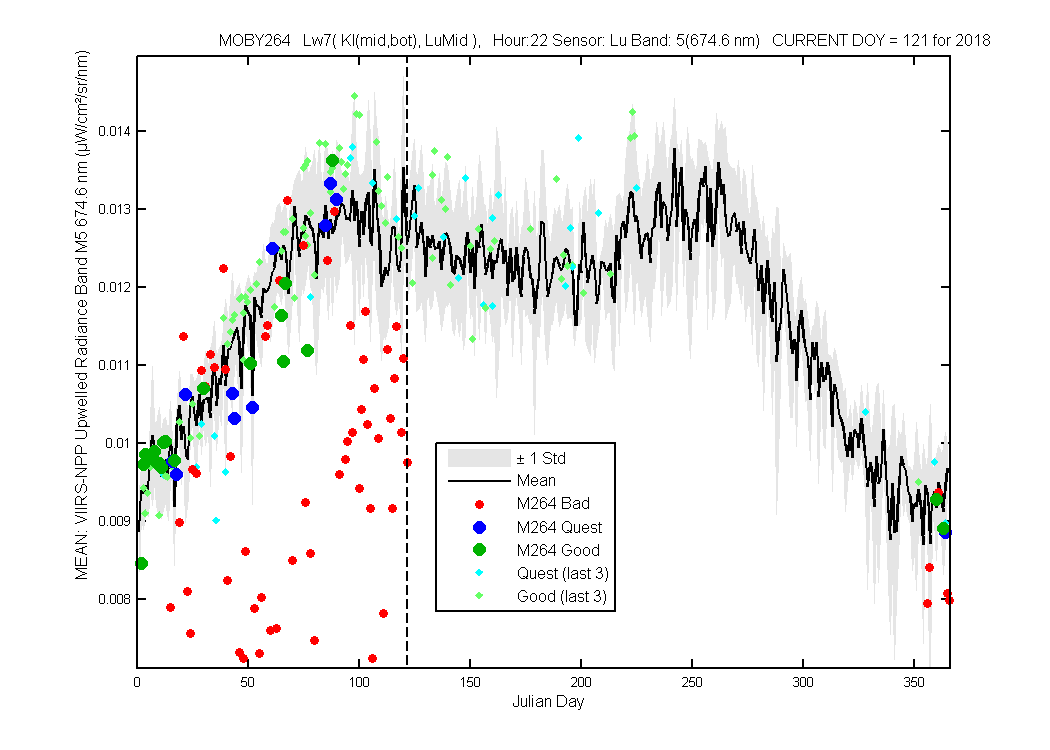
Figure 5
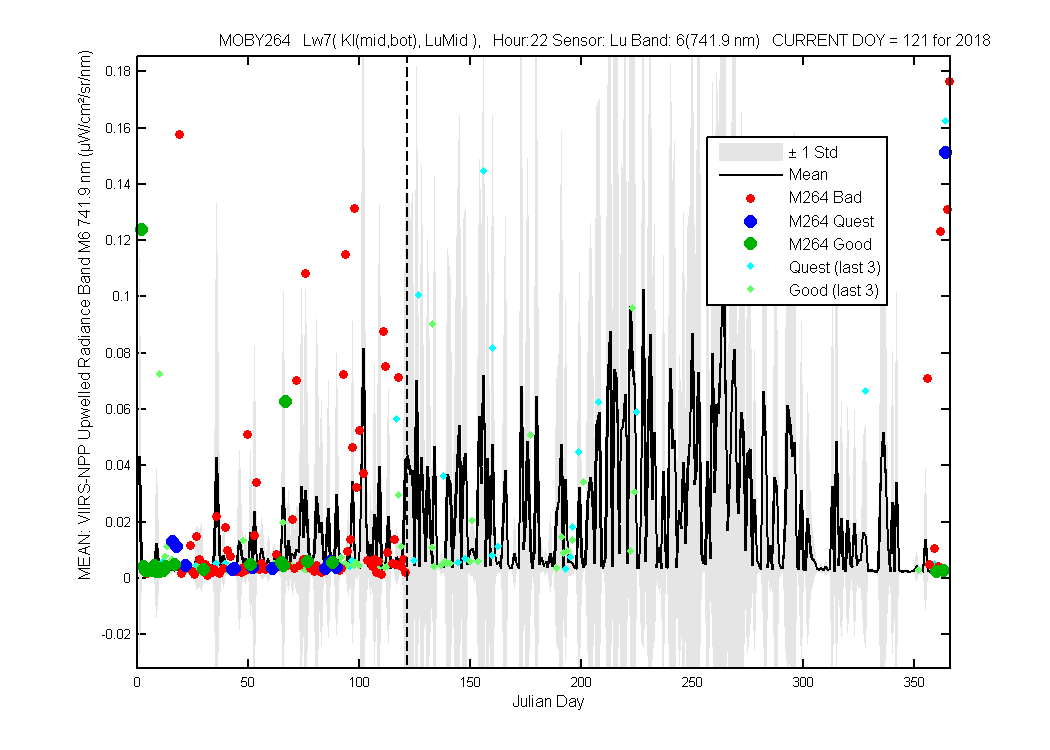
Figure 6
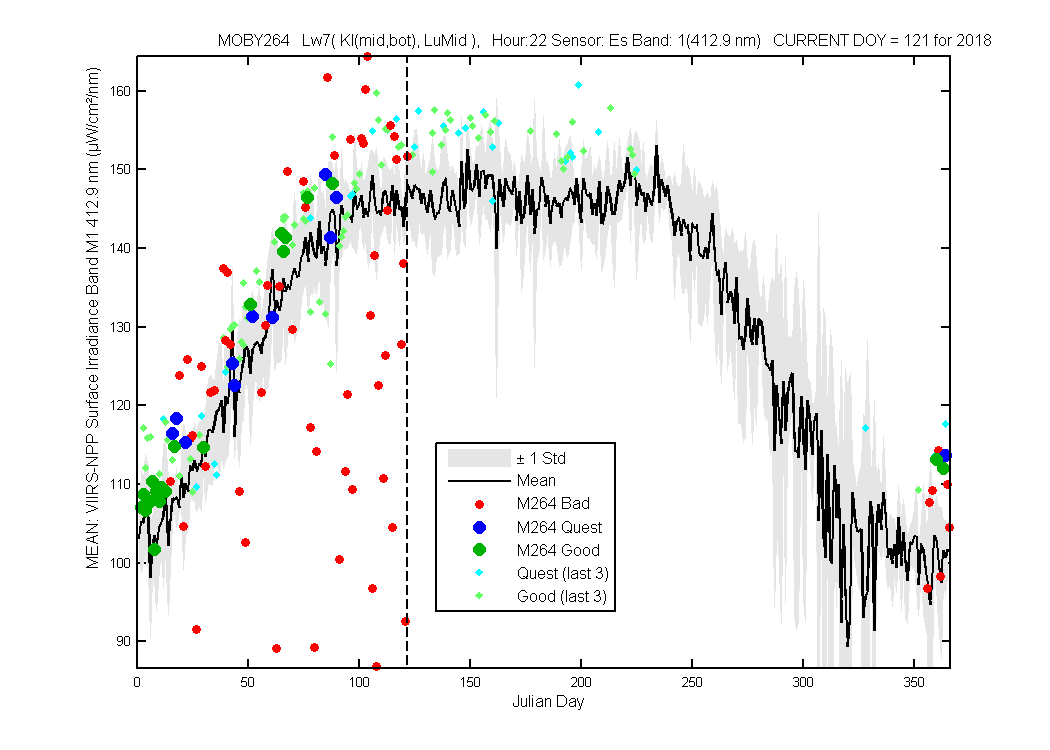
Figure 1
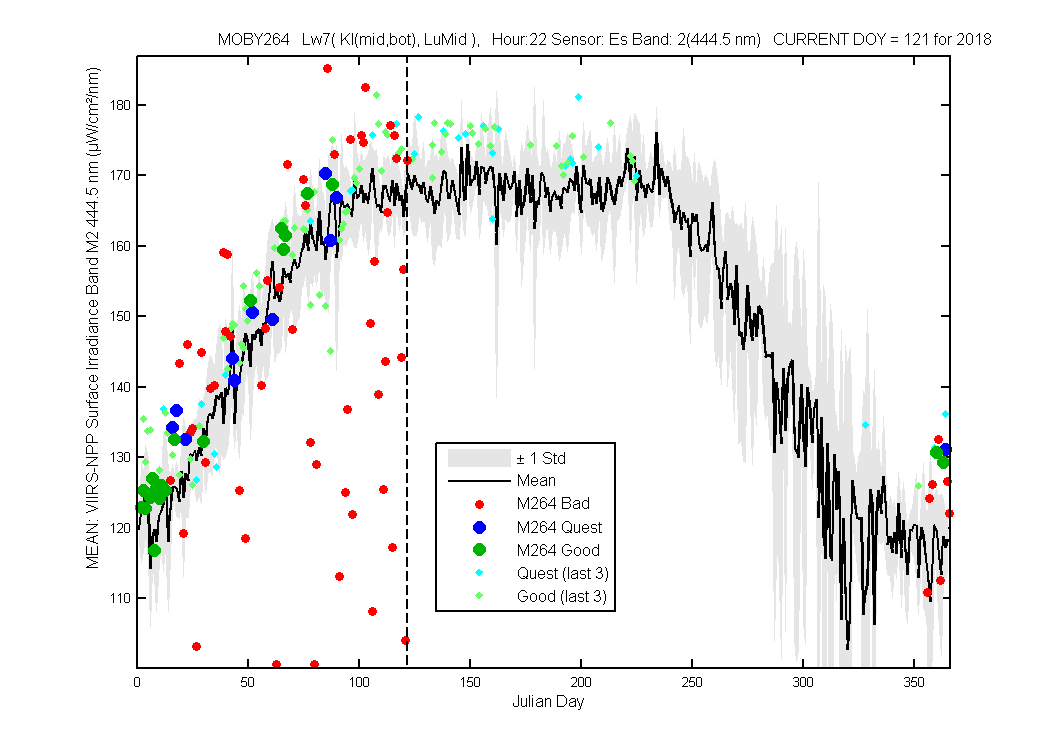
Figure 2
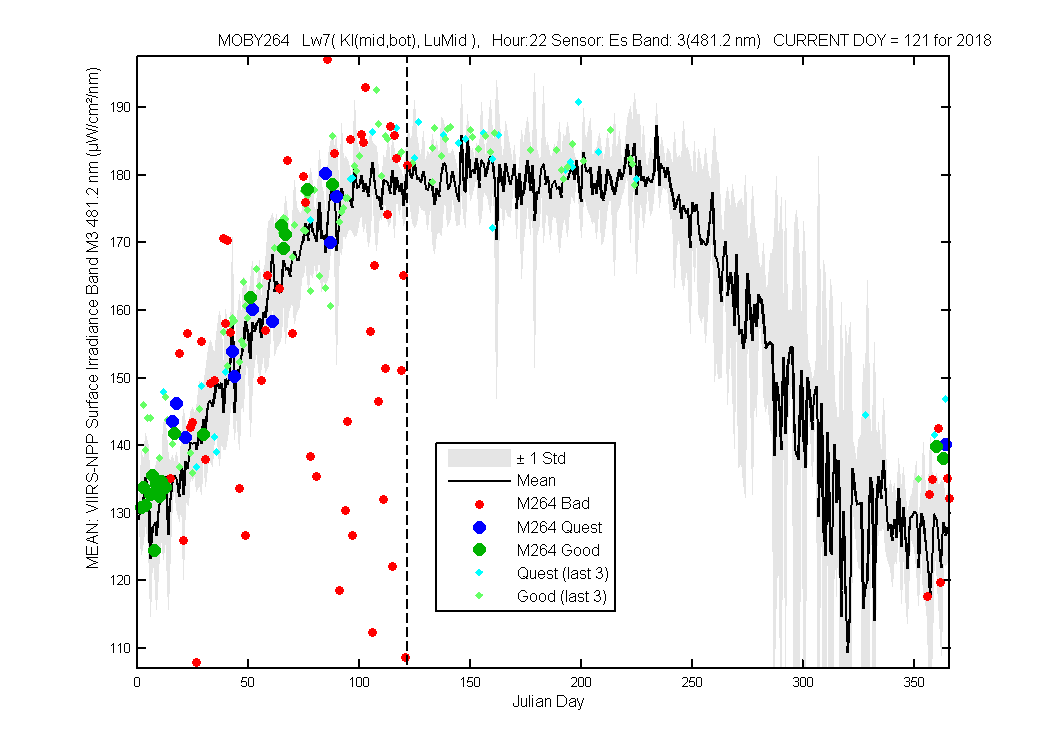
Figure 3
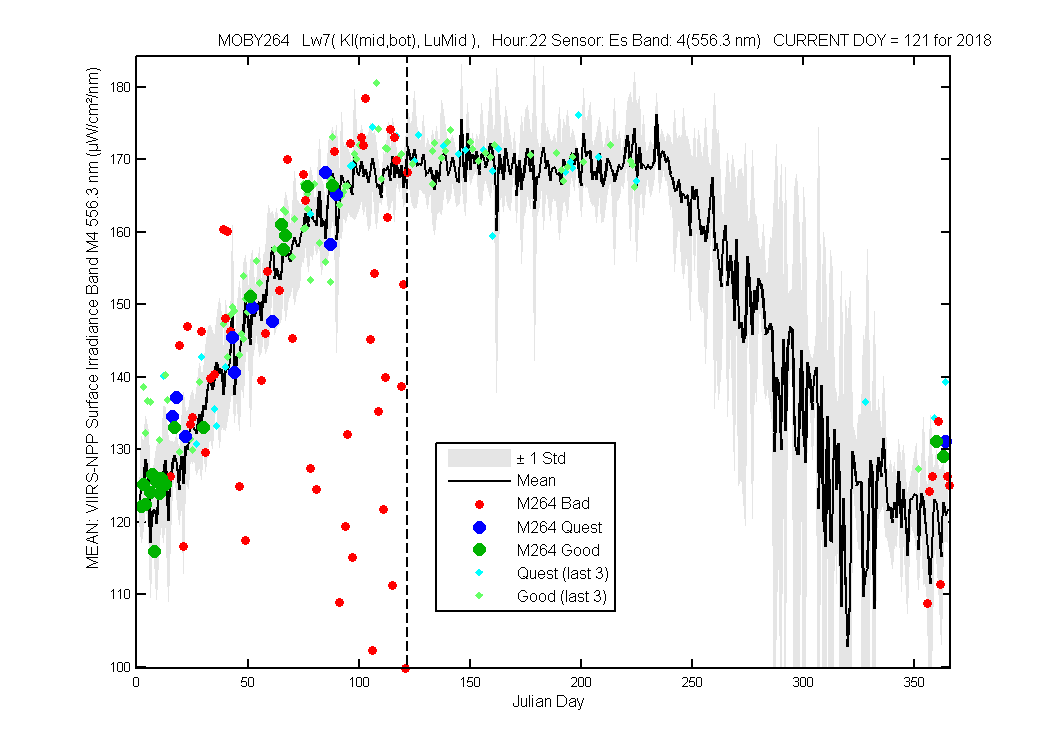
Figure 4
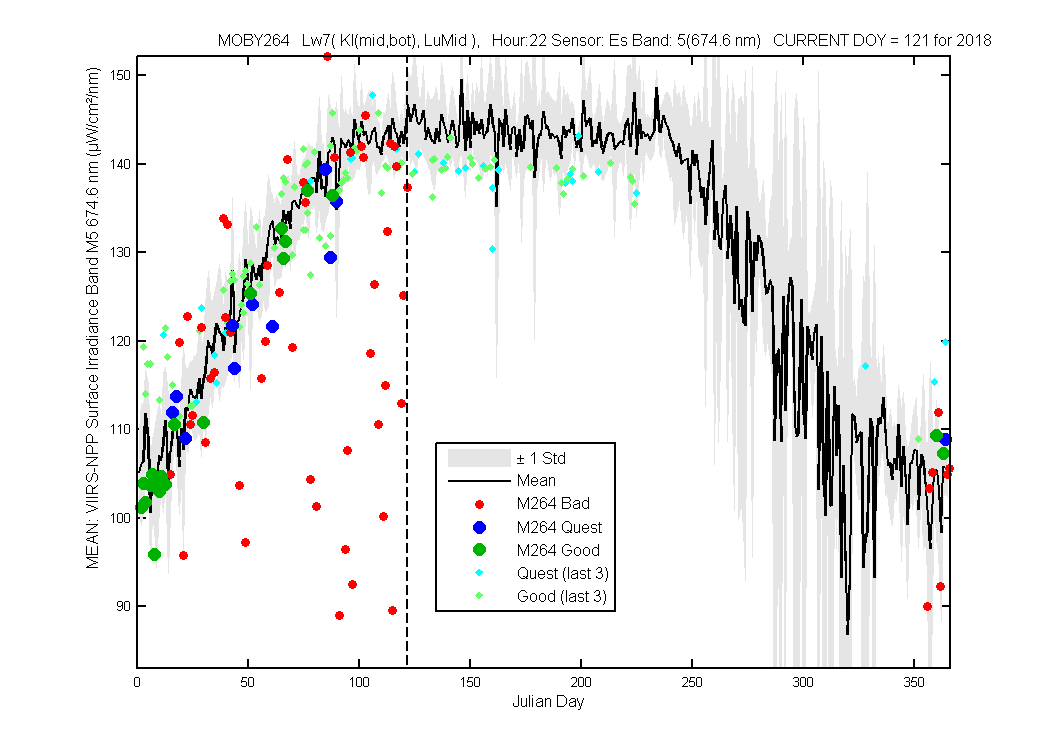
Figure 5
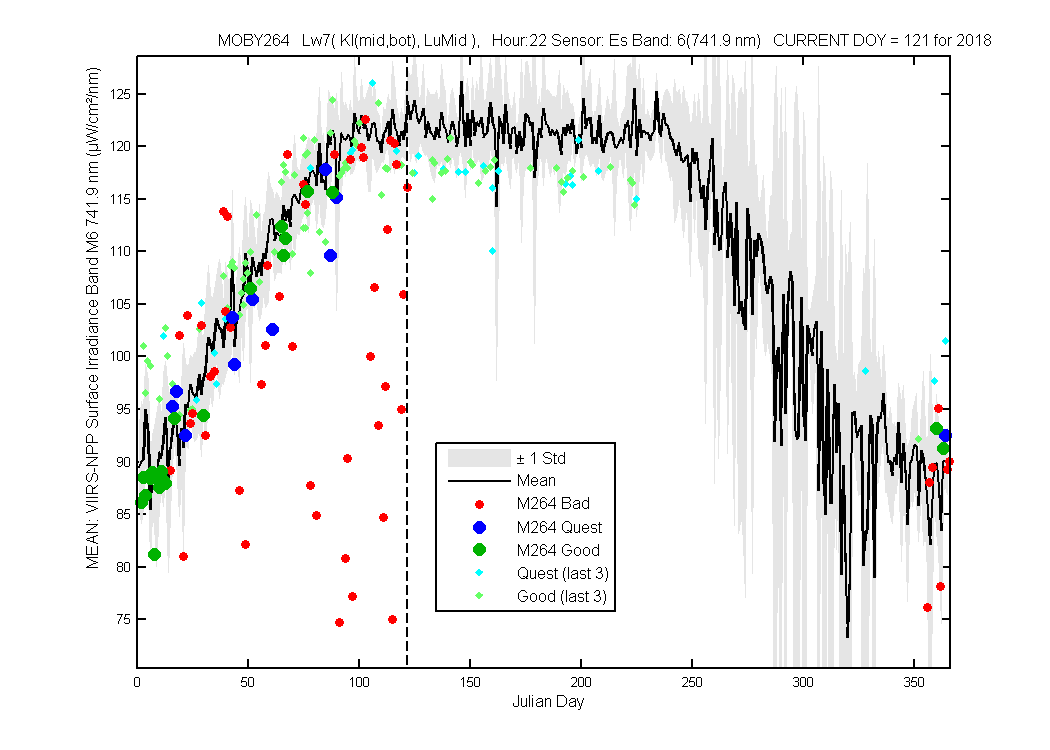
Figure 6
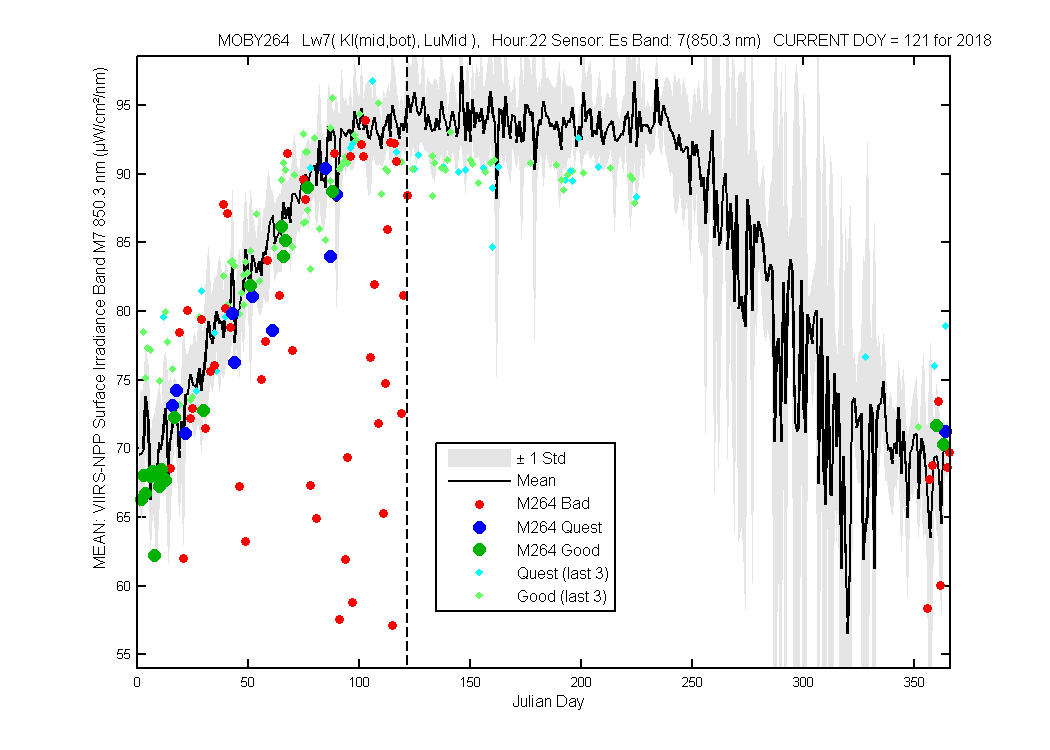
Figure 7
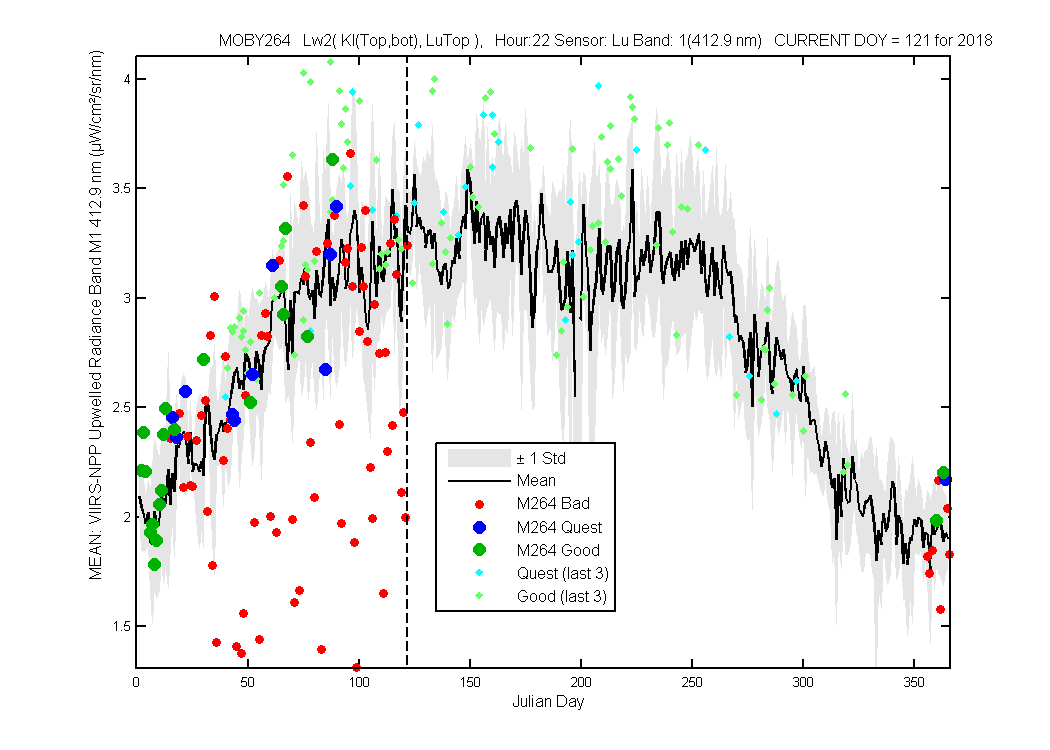
Figure 1
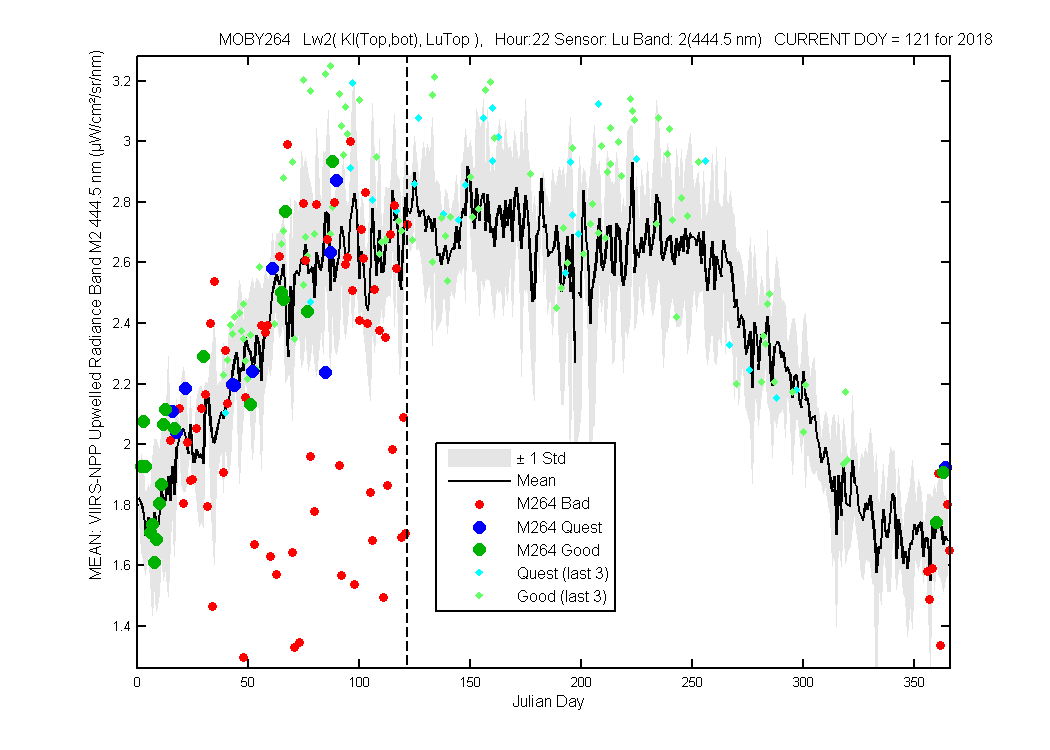
Figure 2

Figure 3

Figure 4
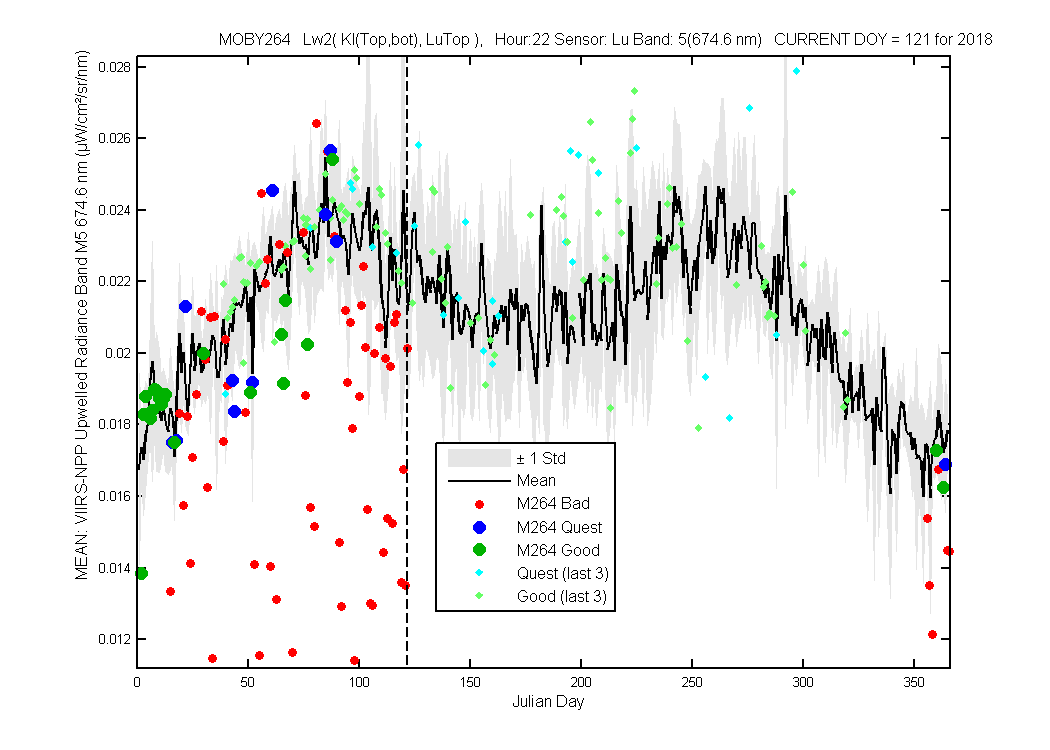
Figure 5
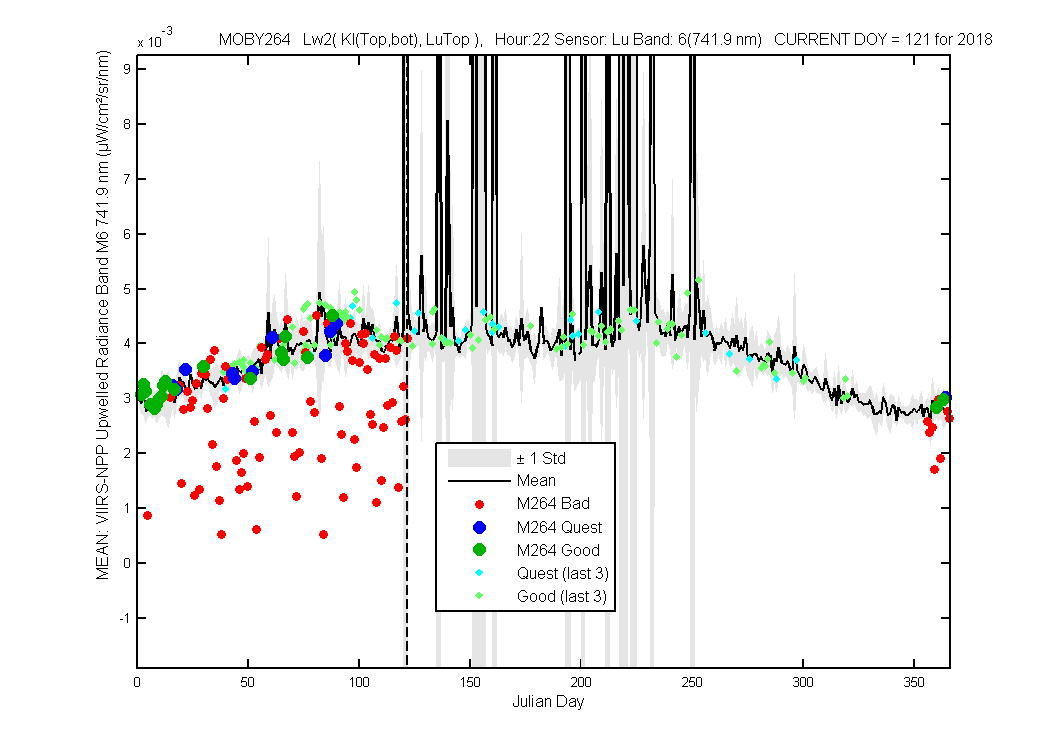
Figure 6
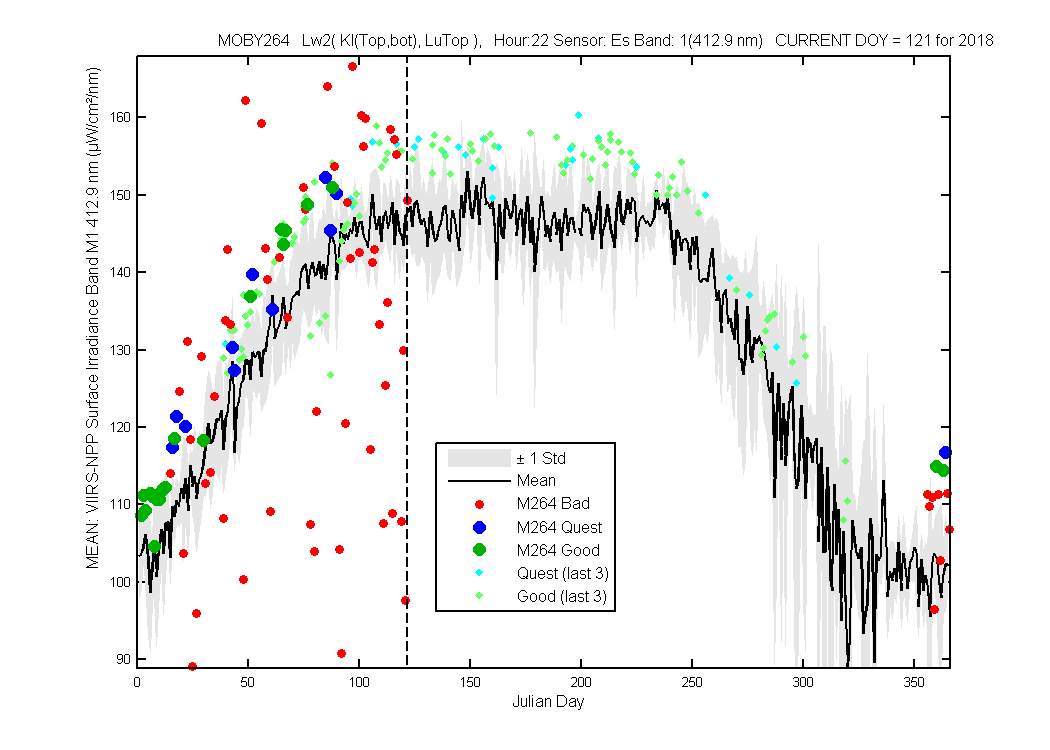
Figure 1
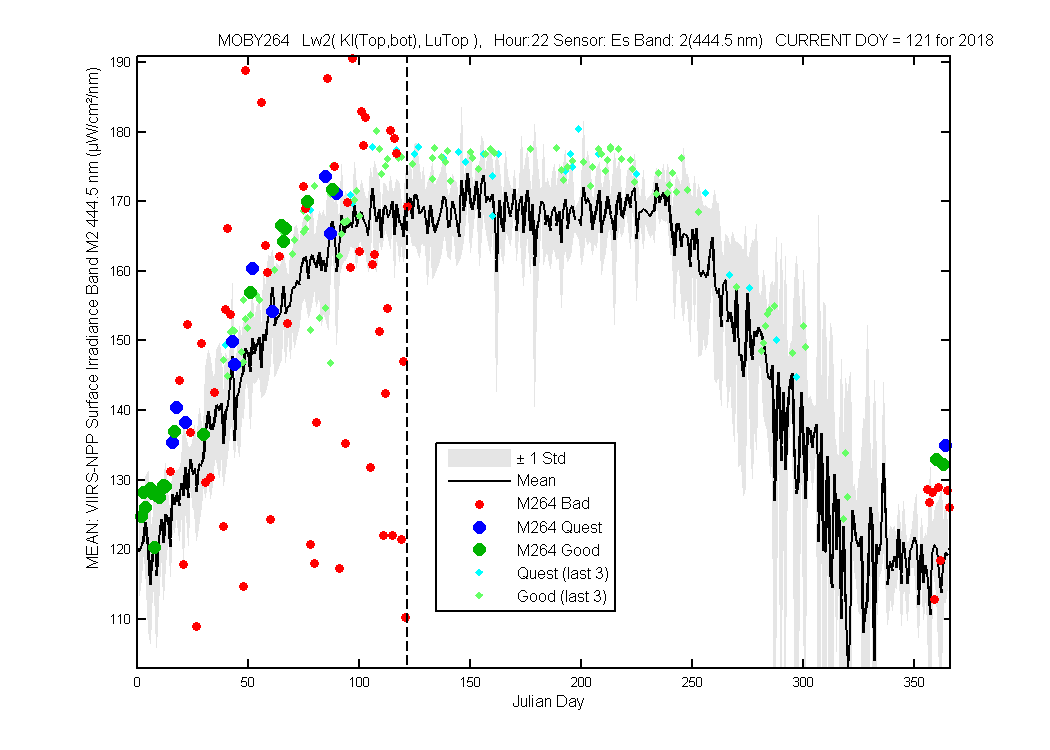
Figure 2
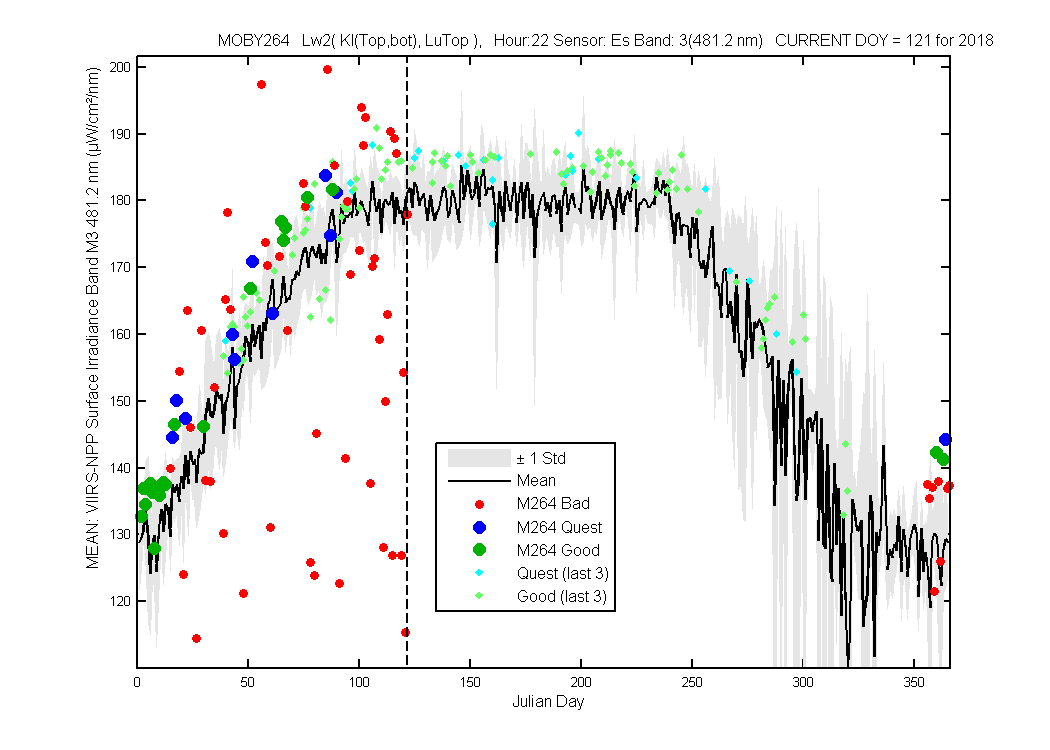
Figure 3
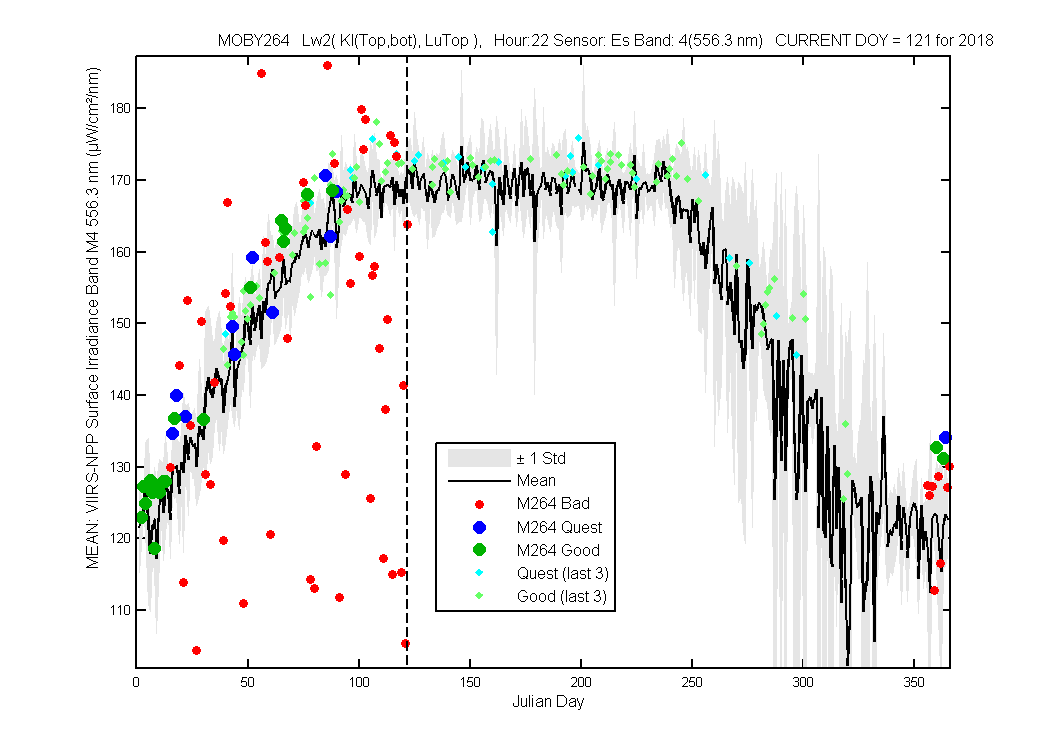
Figure 4
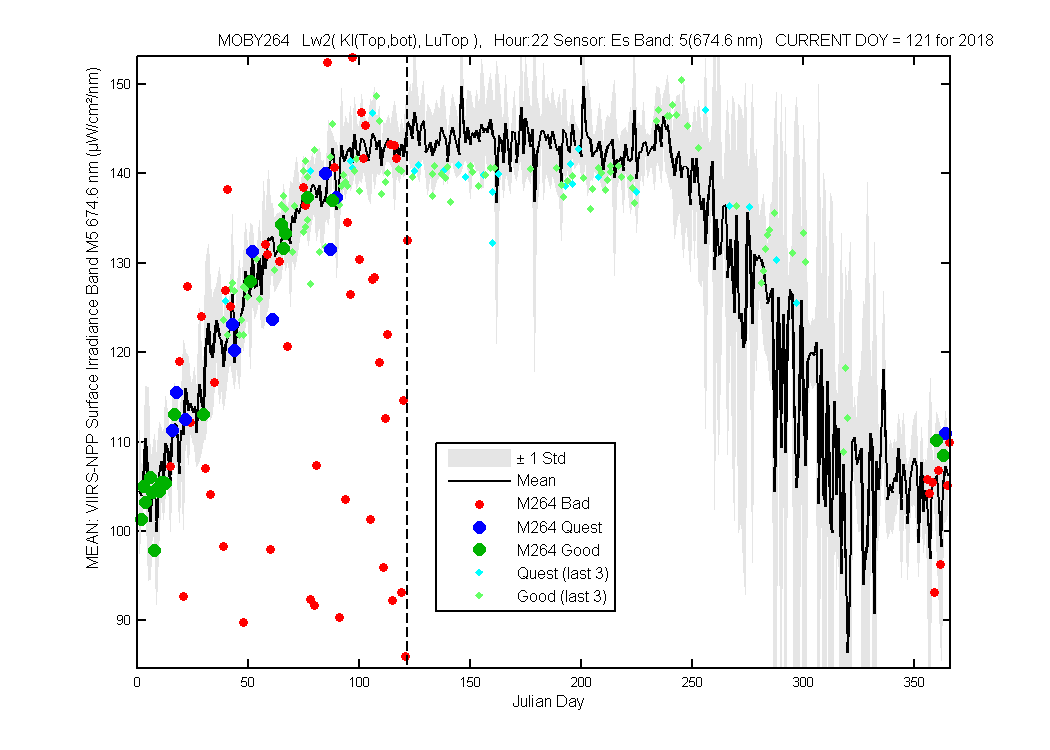
Figure 5

Figure 6
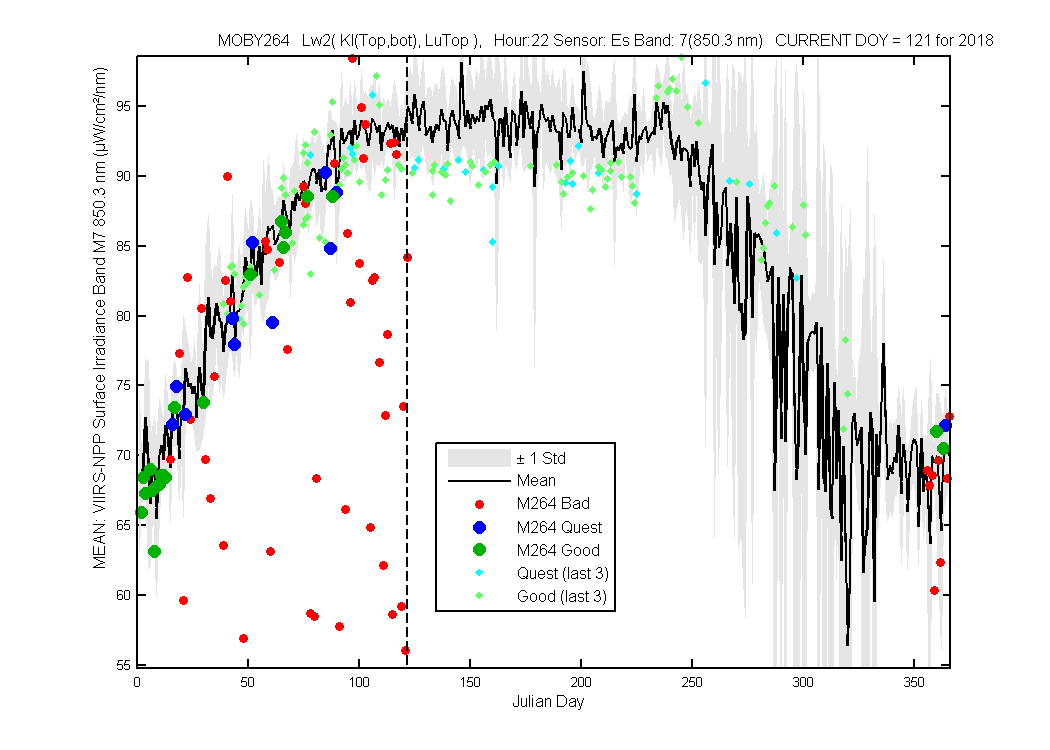
Figure 7
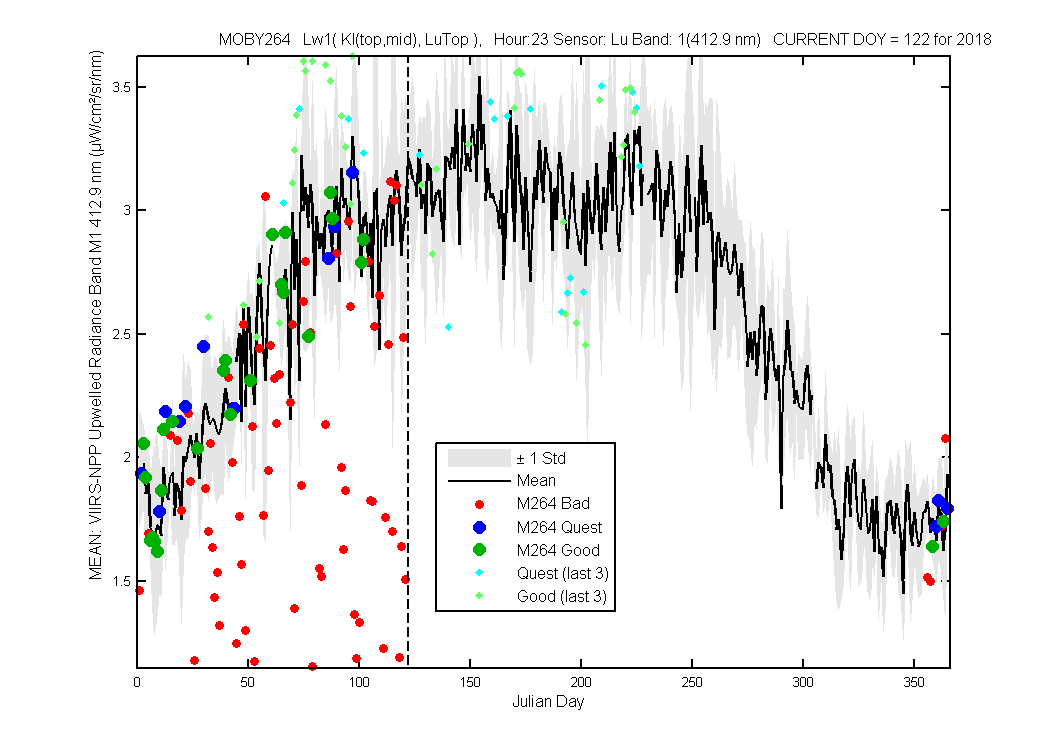
Figure 1
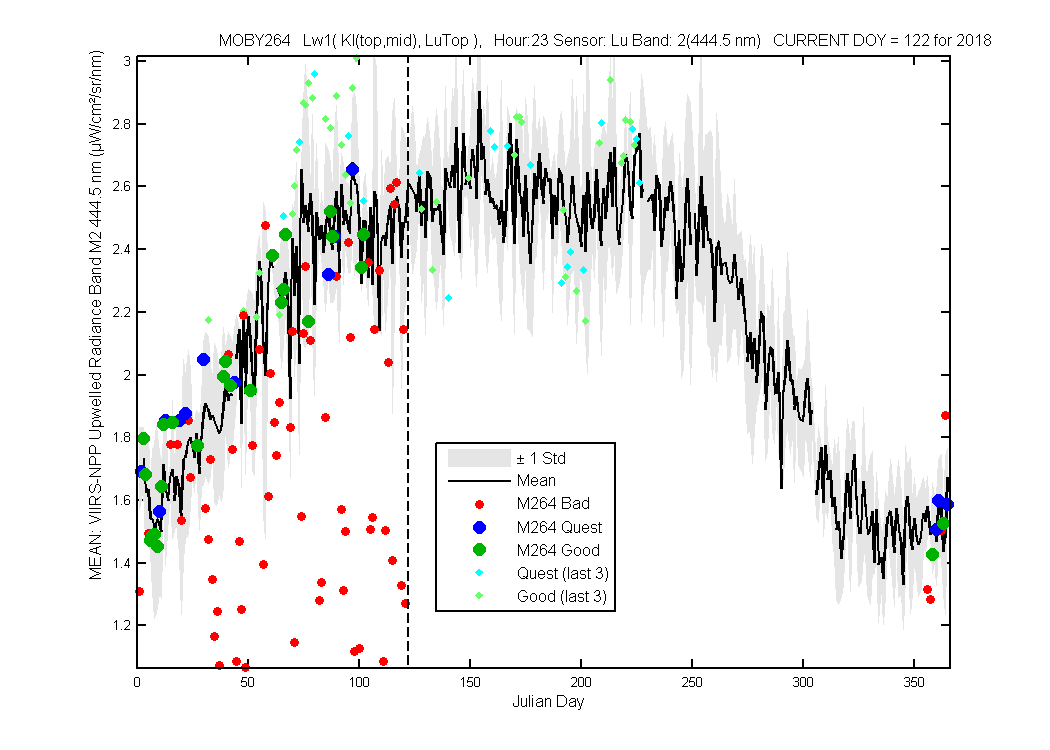
Figure 2
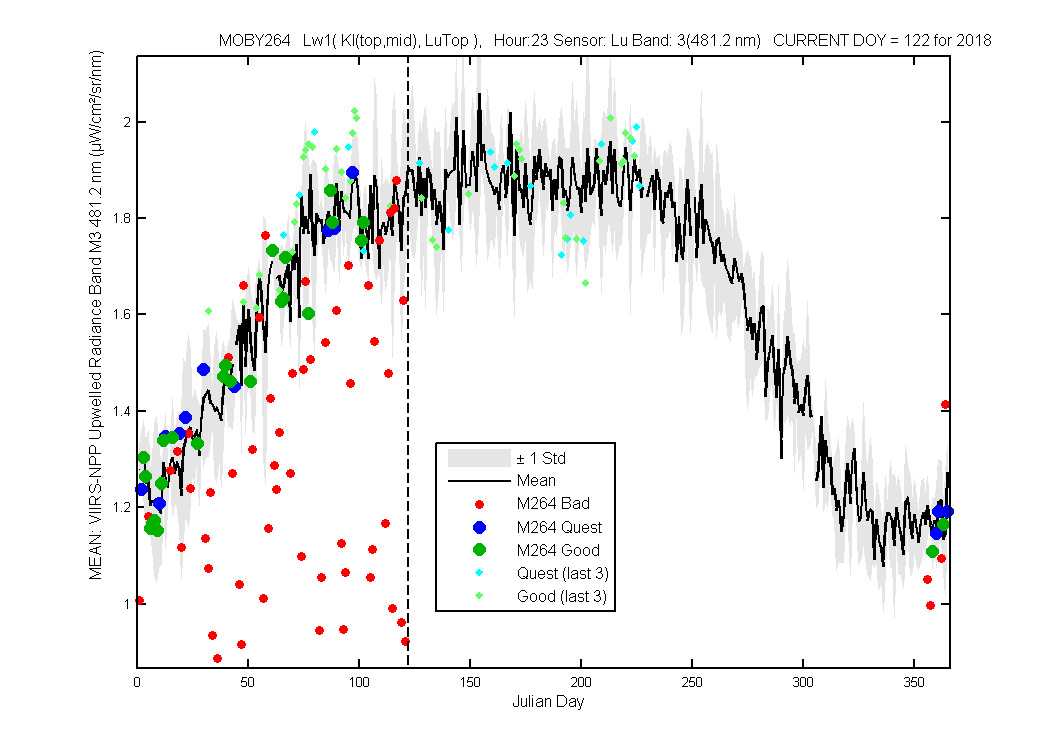
Figure 3
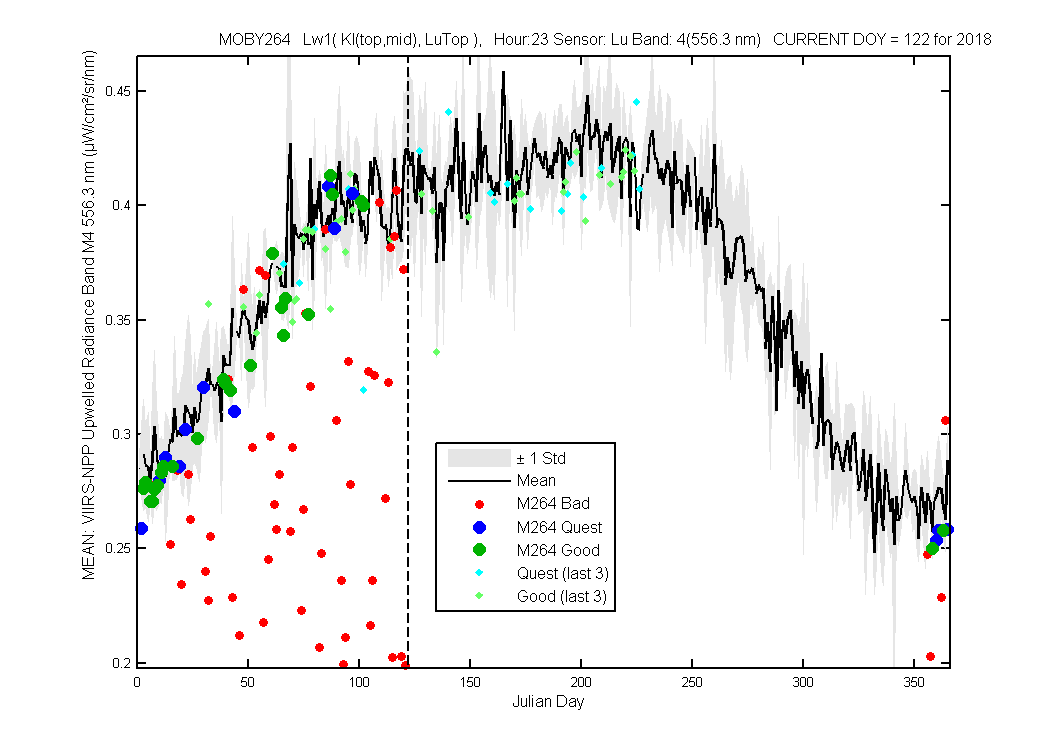
Figure 4
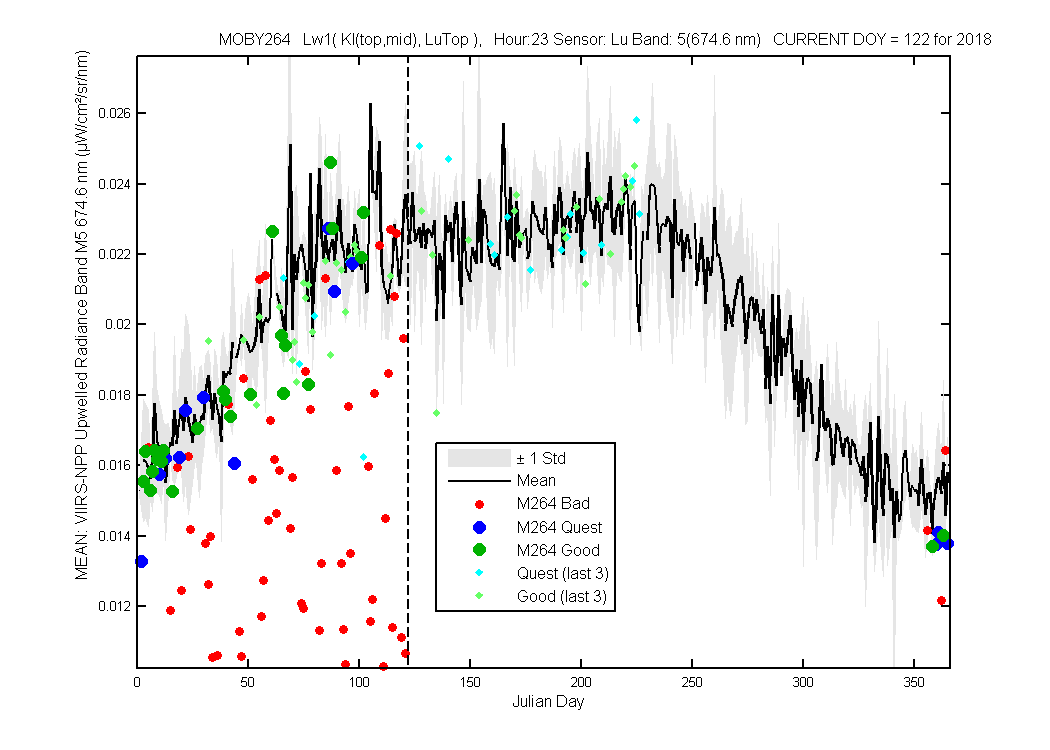
Figure 5
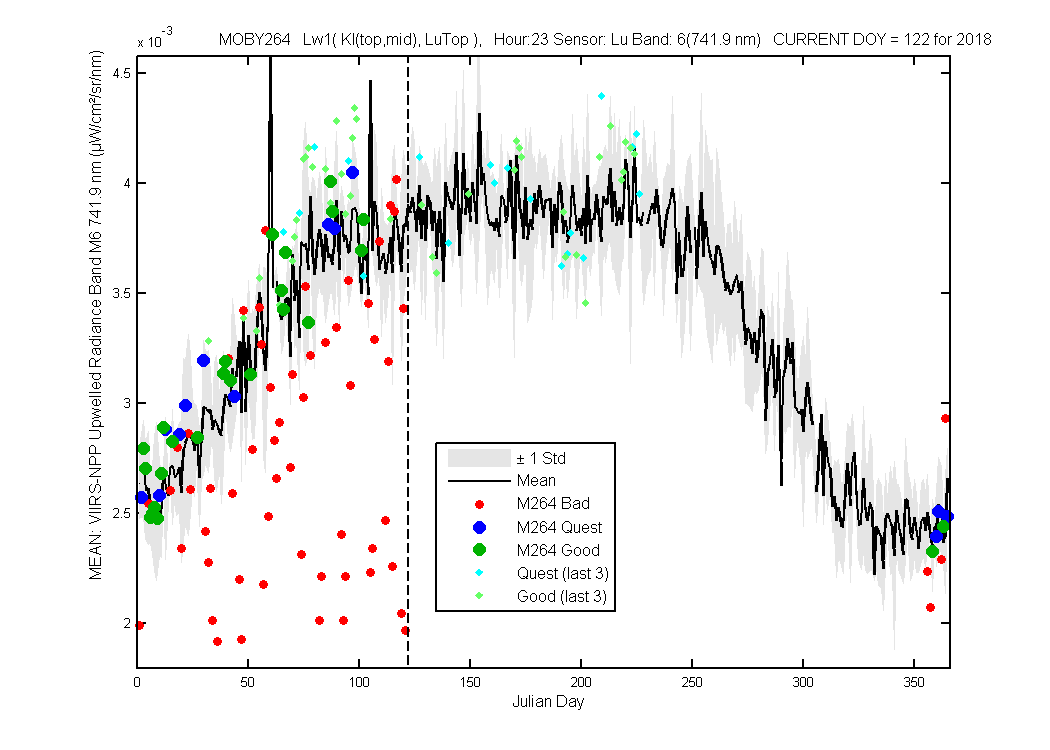
Figure 6
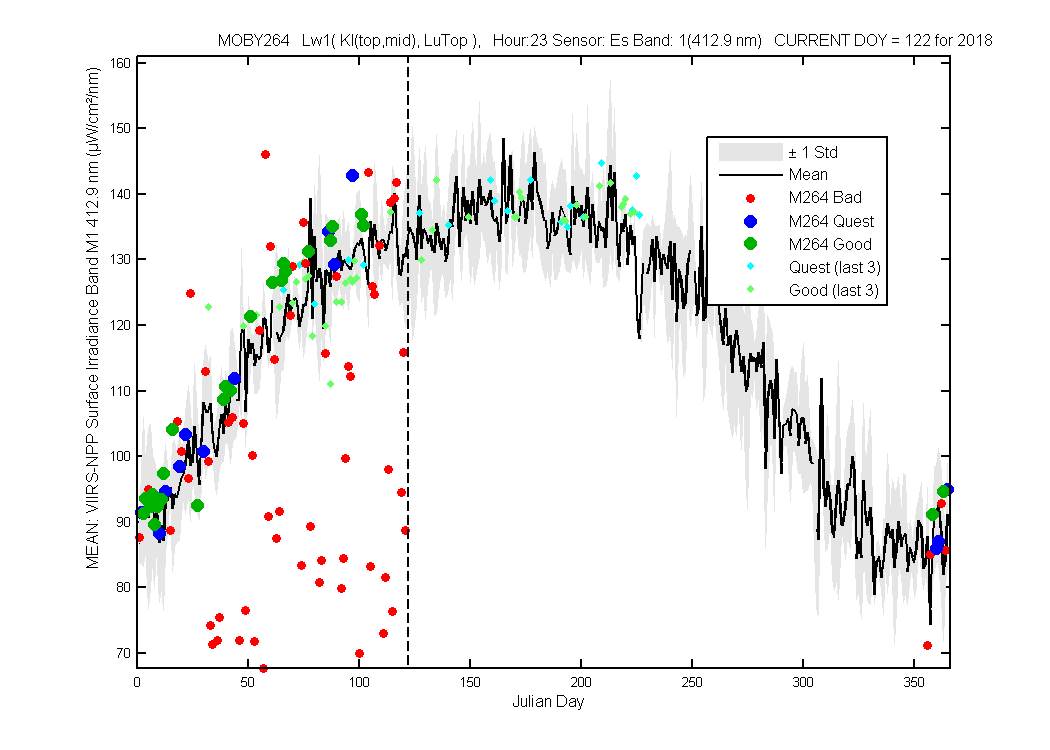
Figure 1

Figure 2
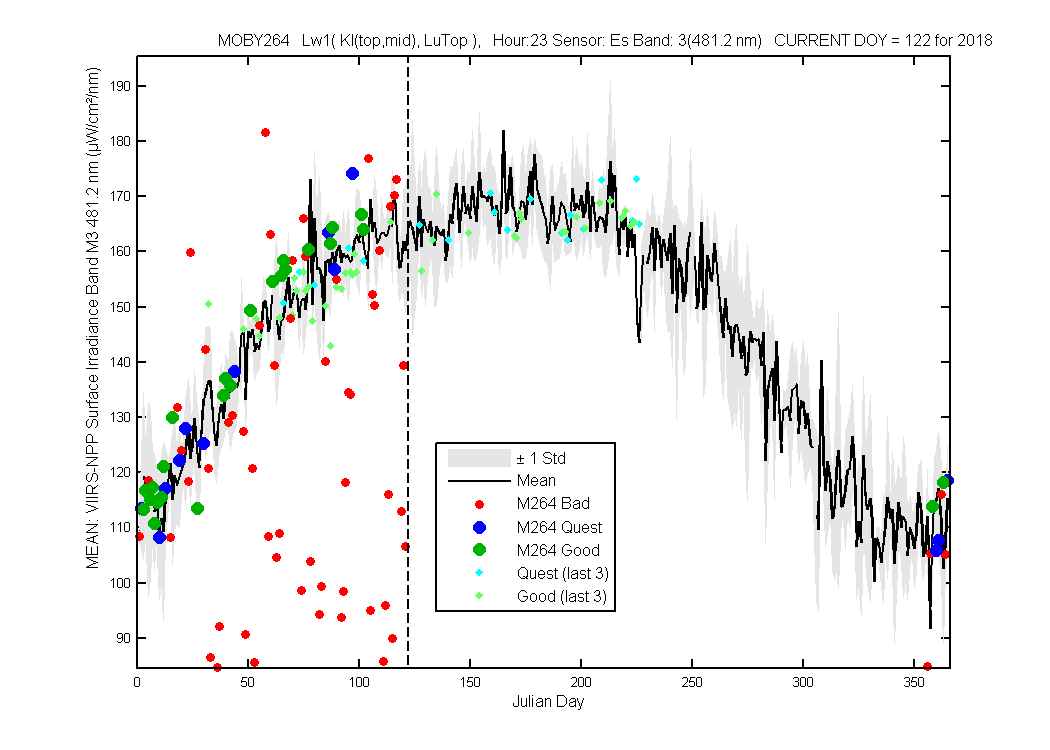
Figure 3
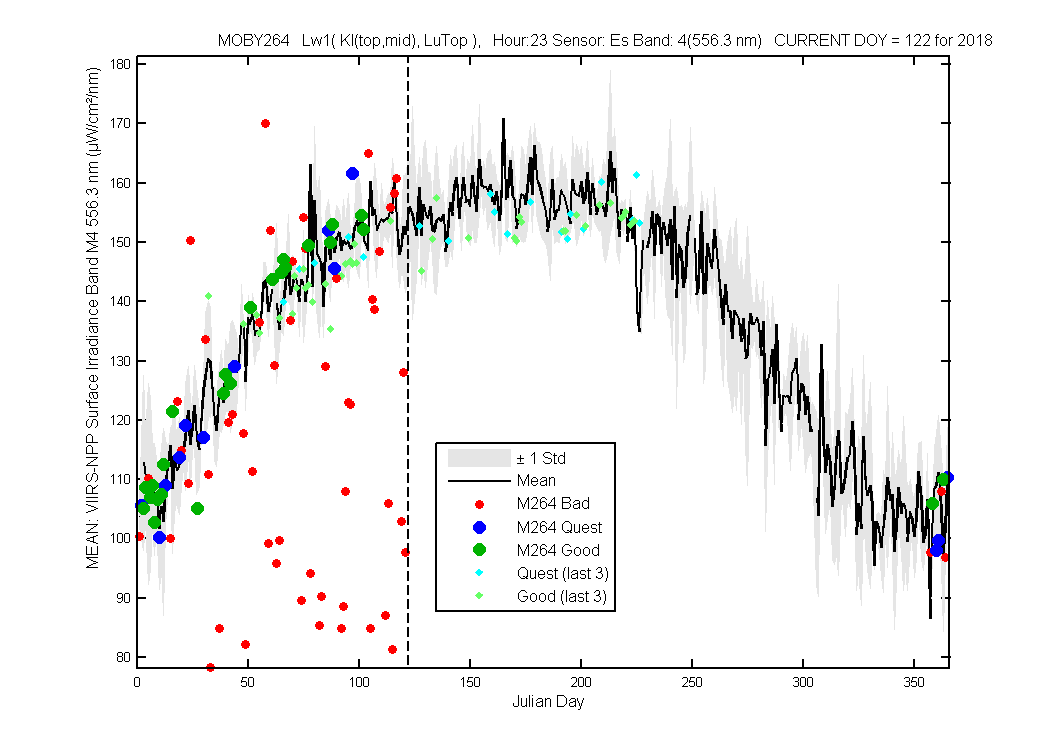
Figure 4
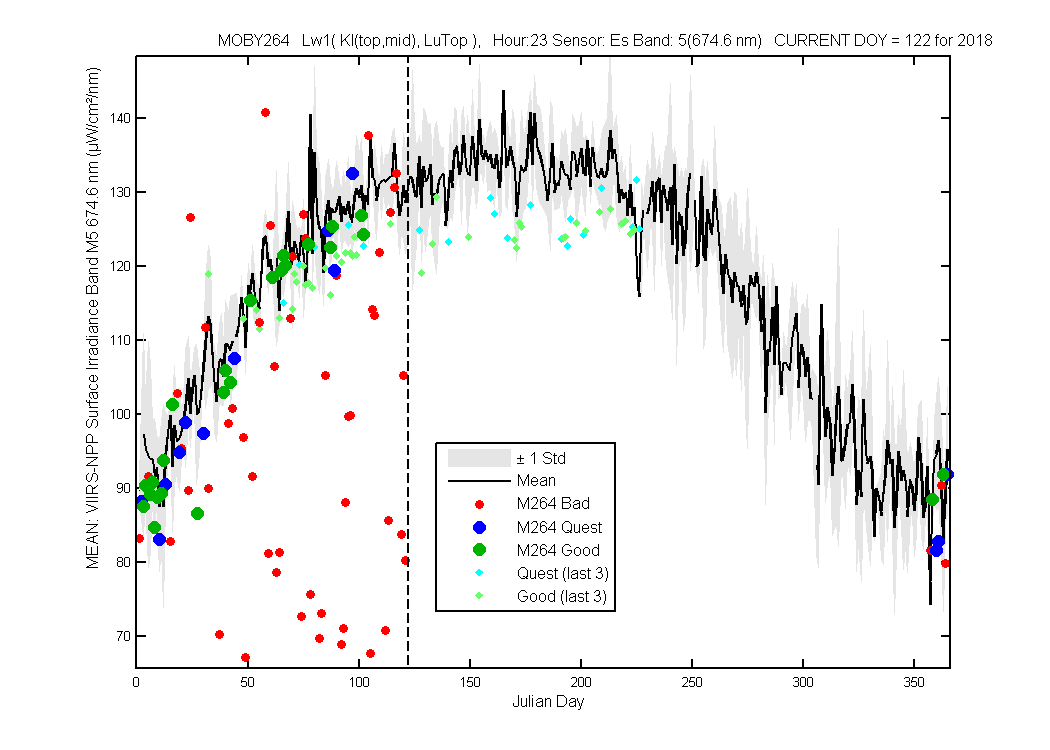
Figure 5
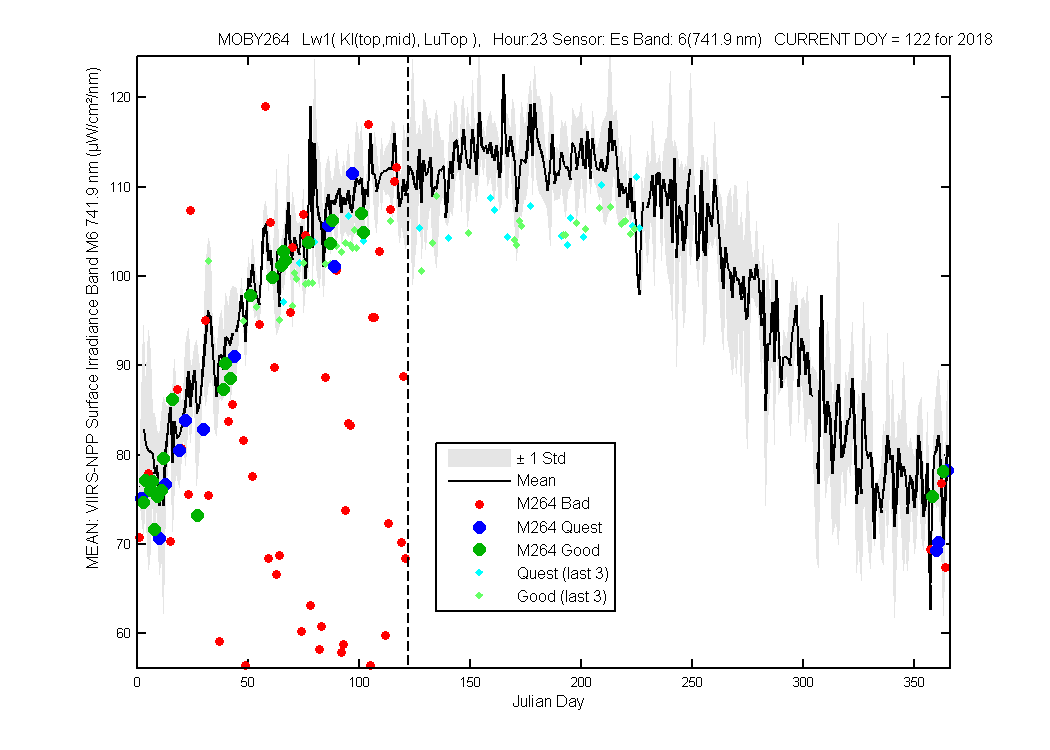
Figure 6
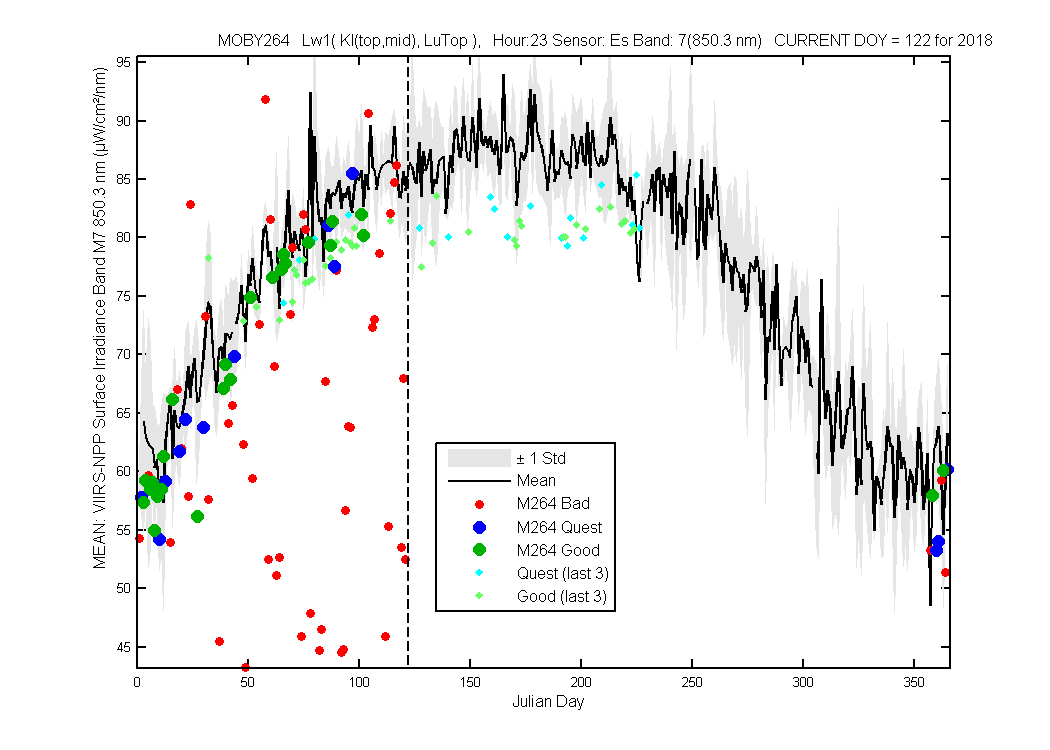
Figure 7
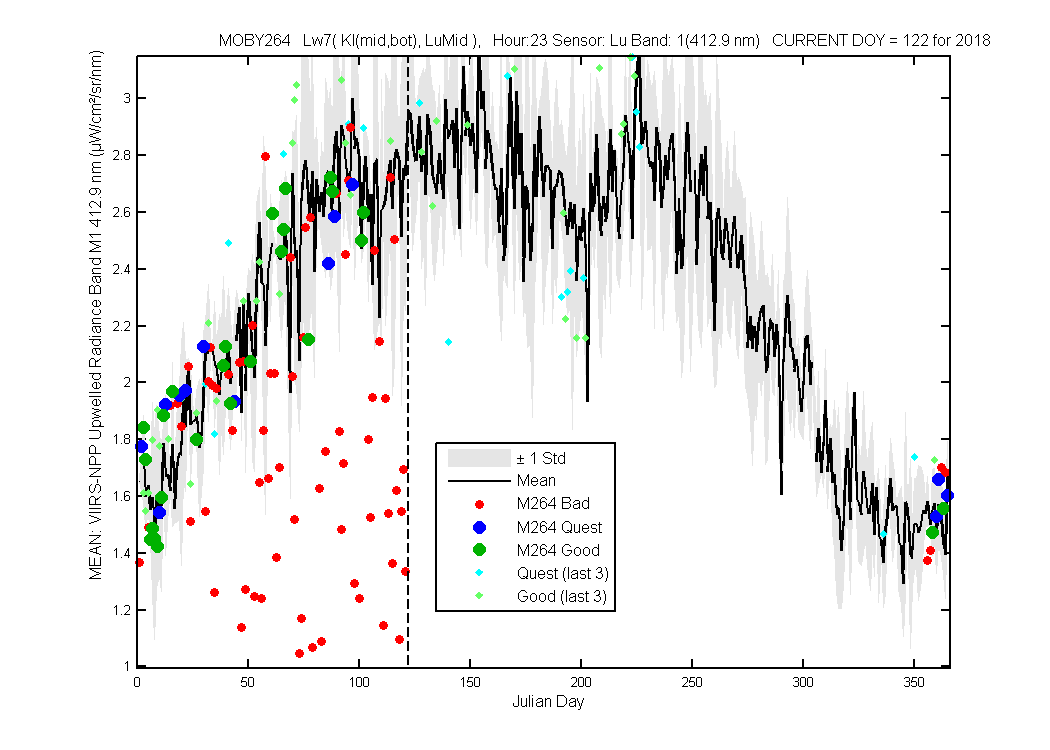
Figure 1
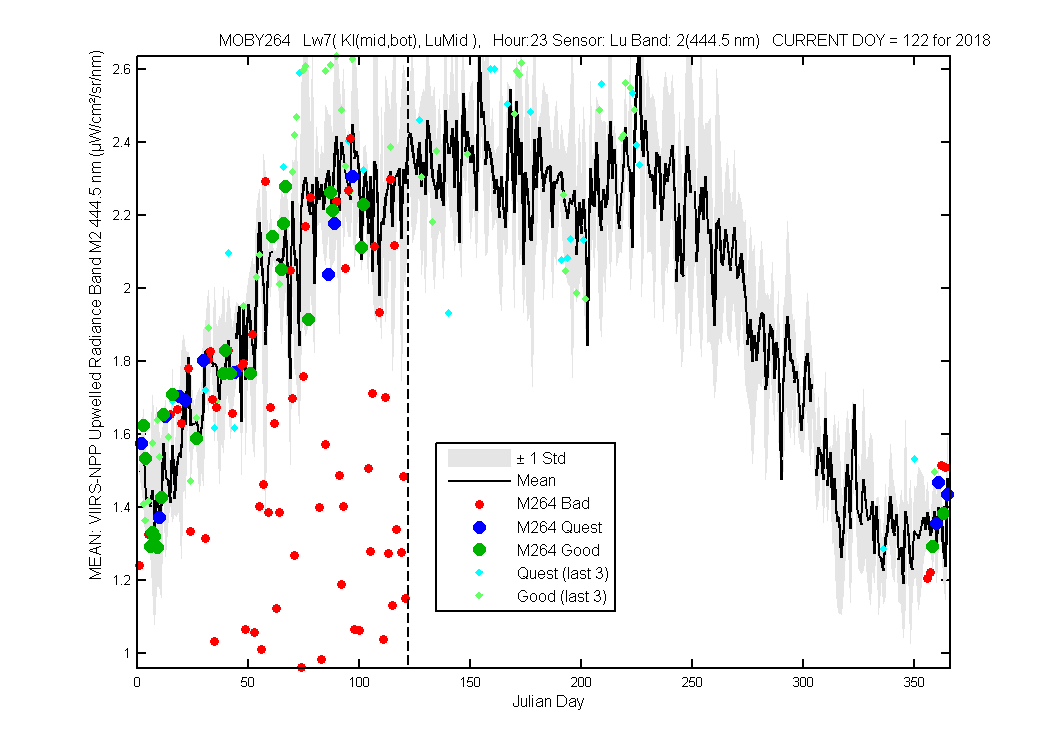
Figure 2
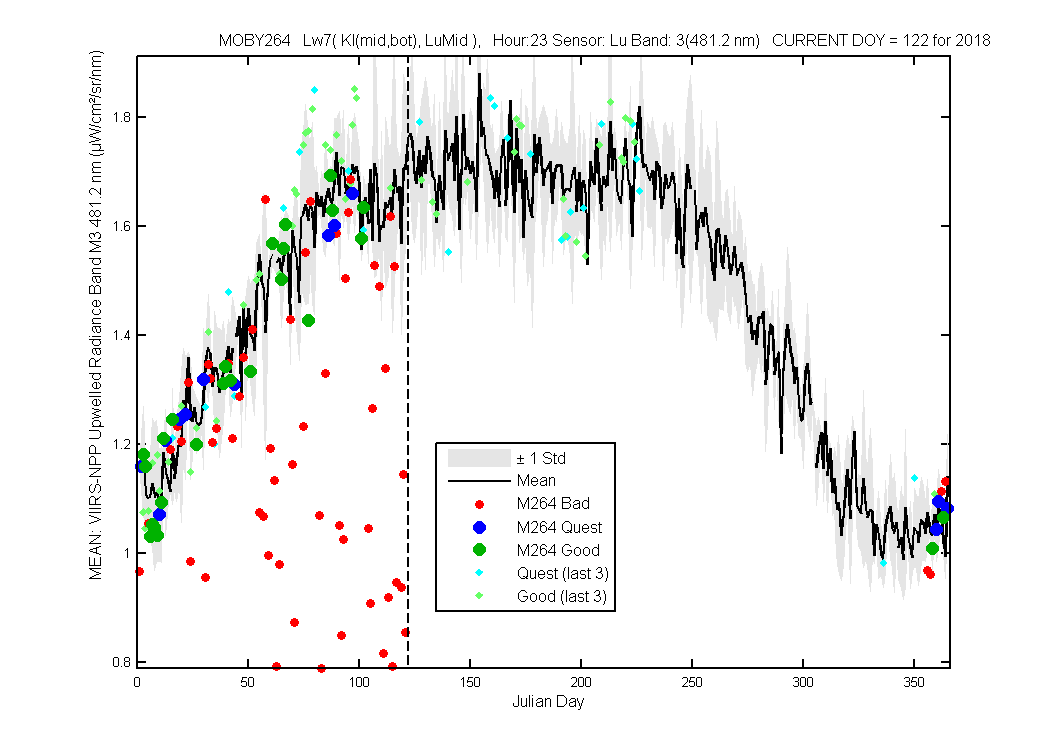
Figure 3
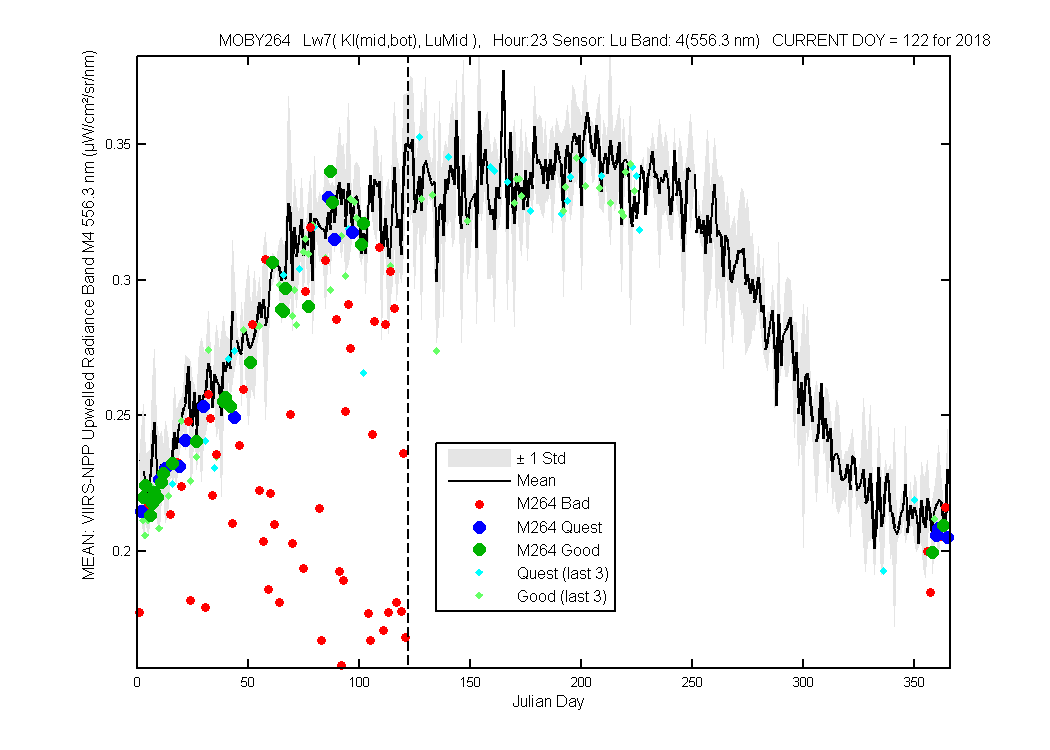
Figure 4
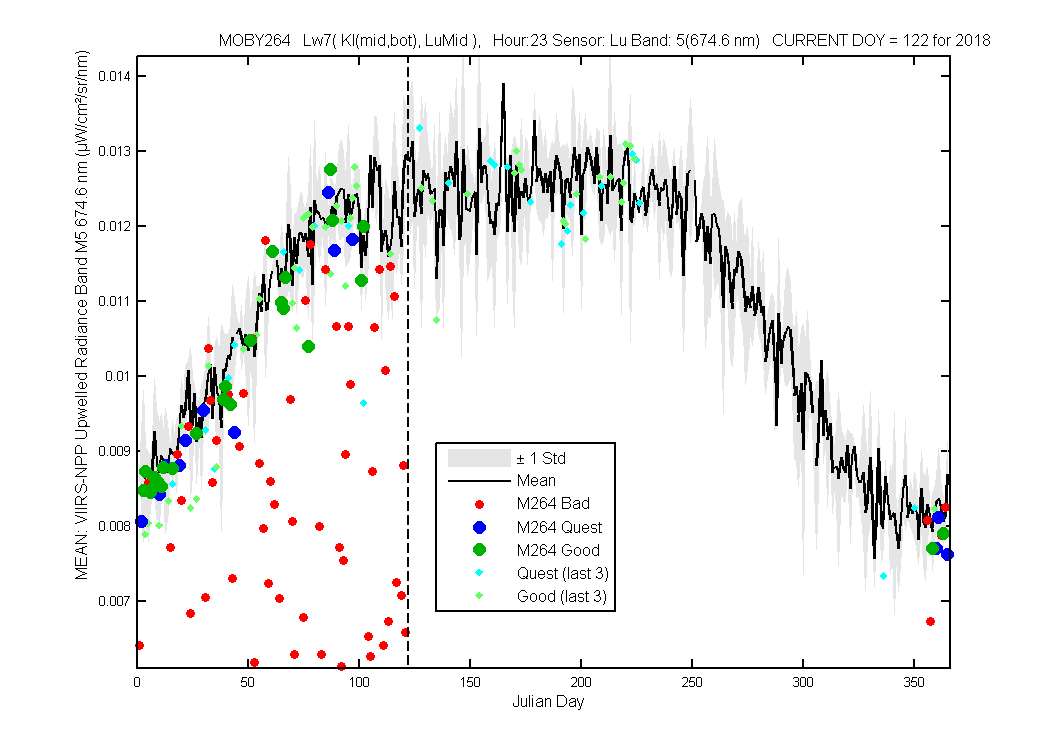
Figure 5
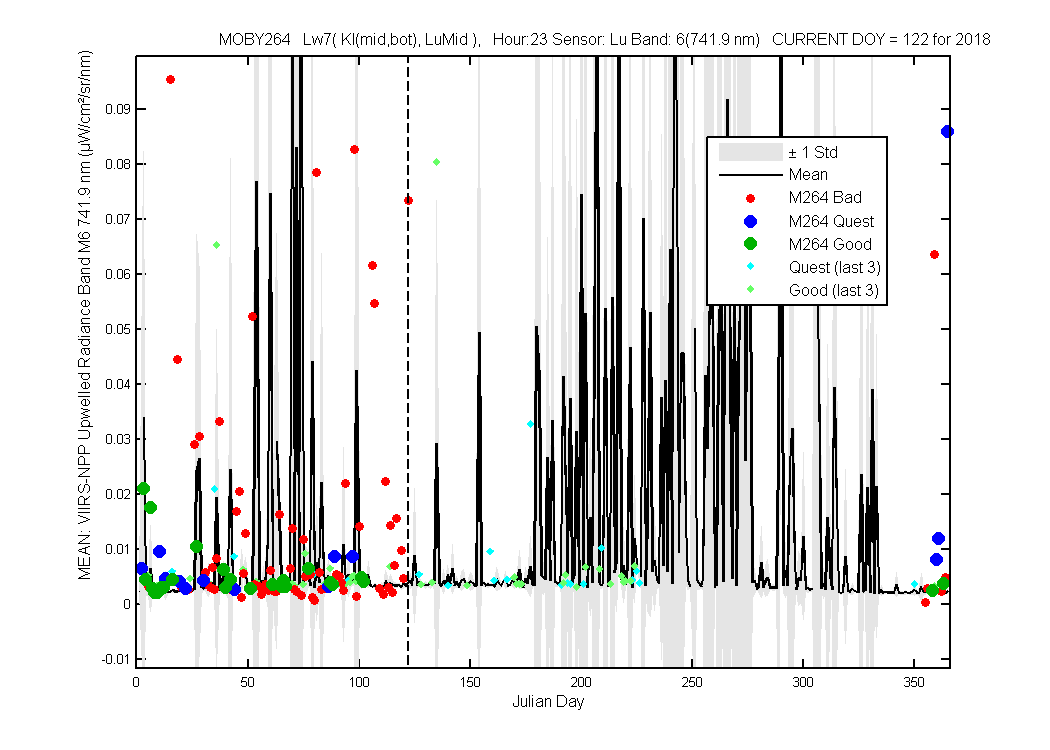
Figure 6
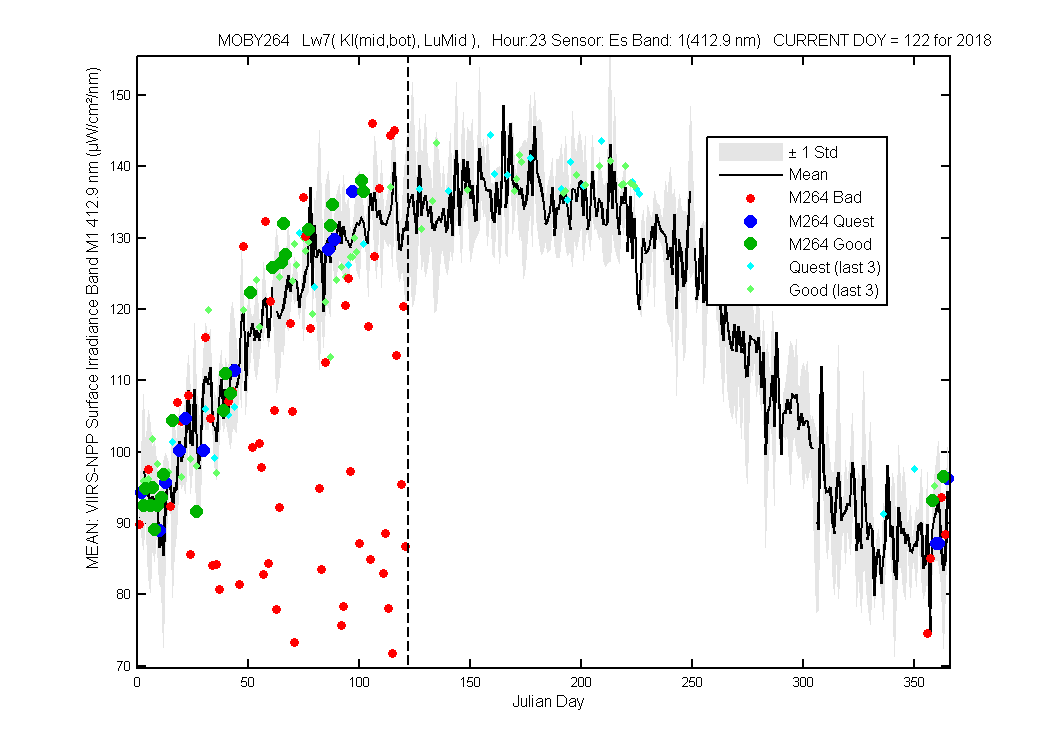
Figure 1
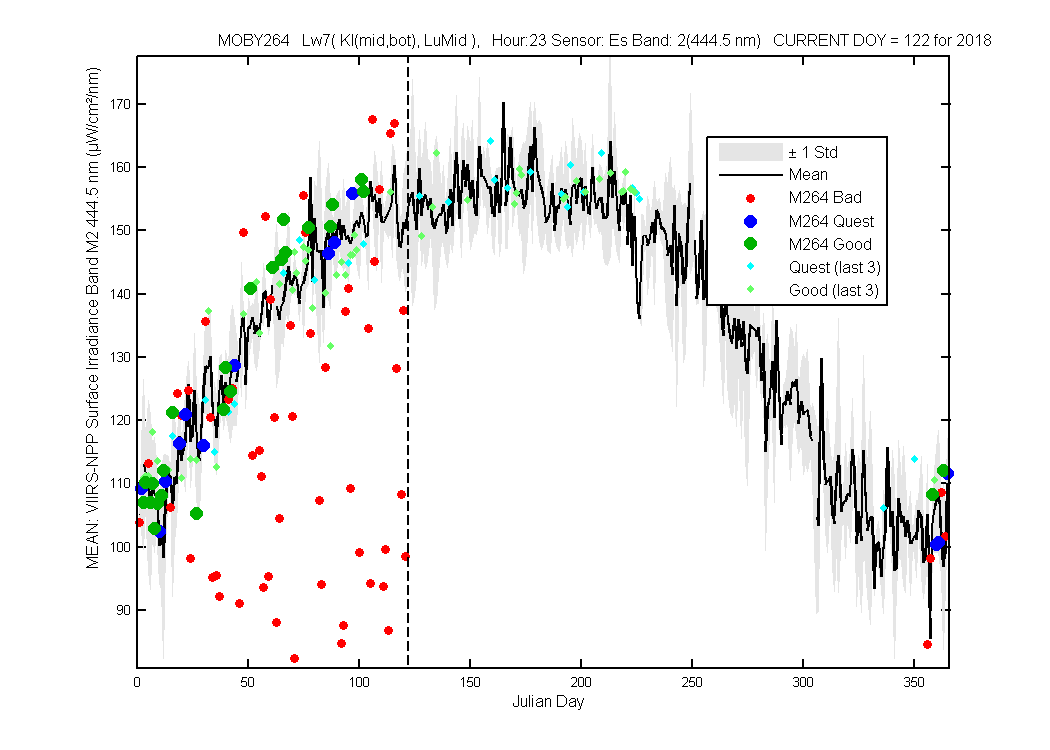
Figure 2
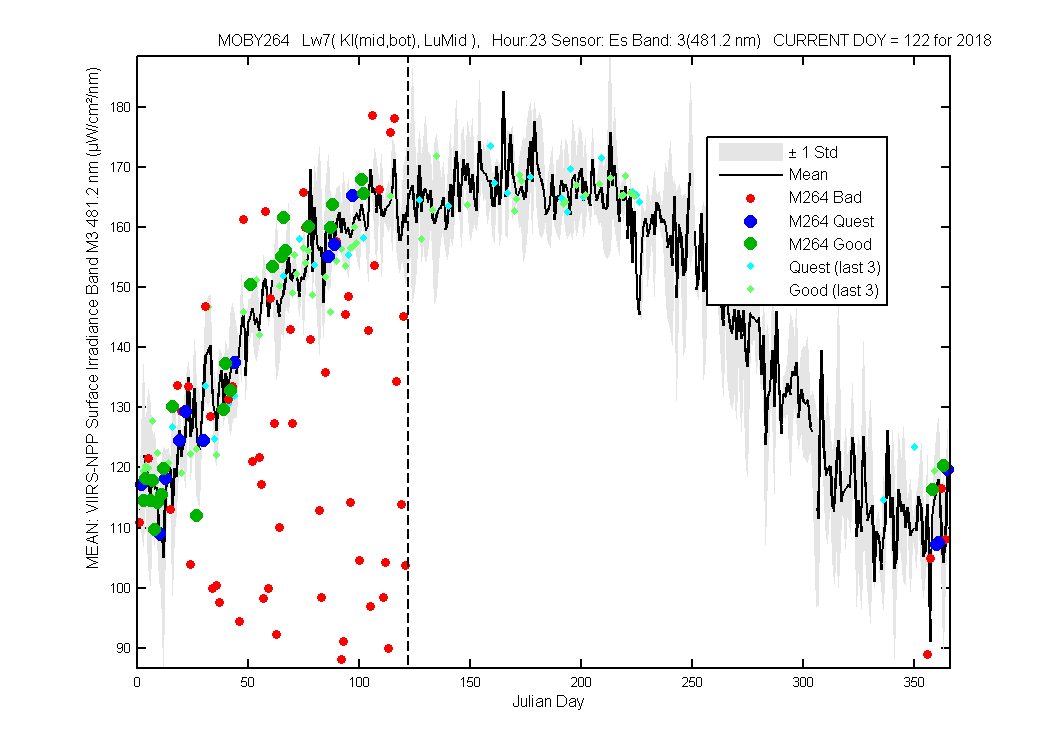
Figure 3
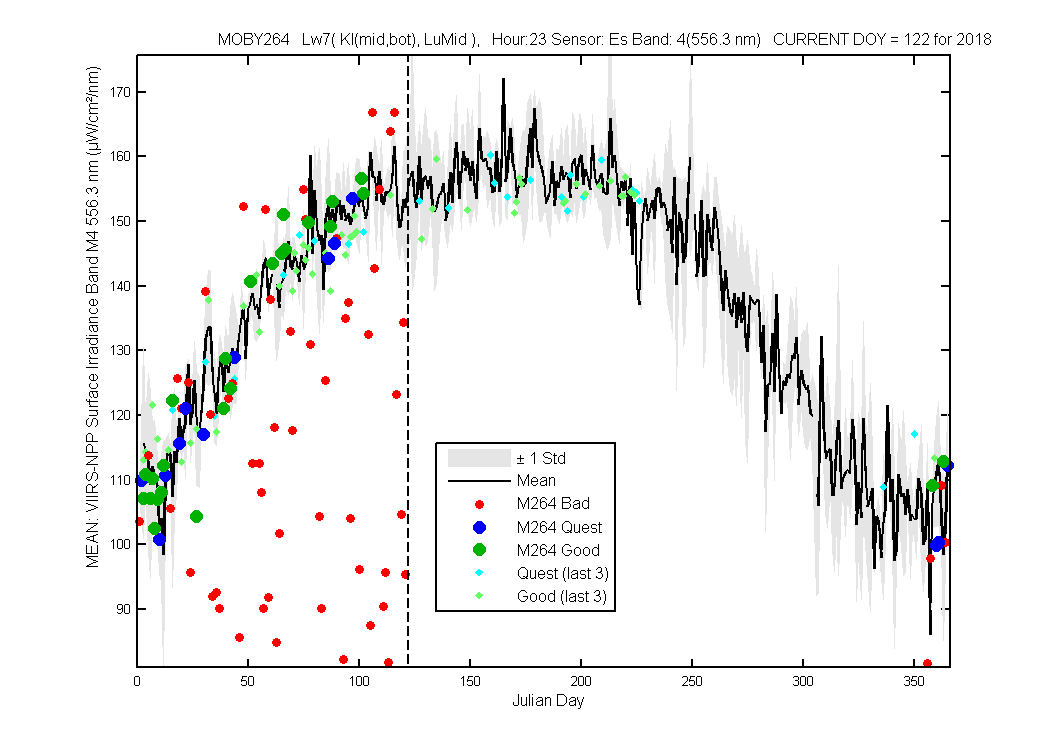
Figure 4
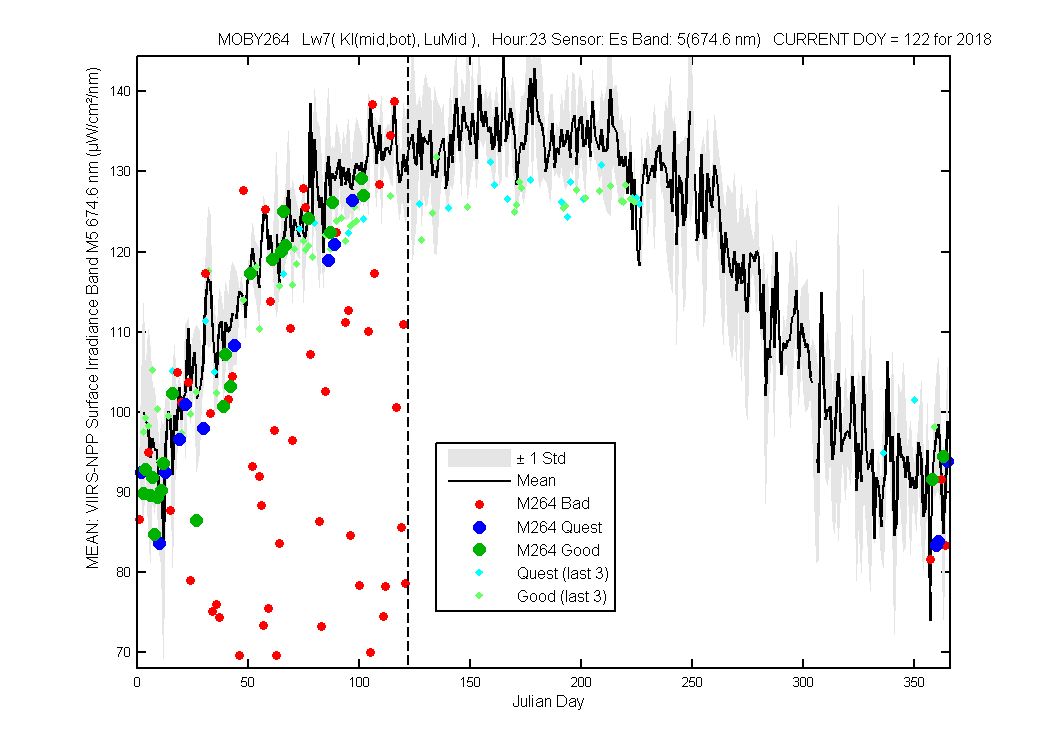
Figure 5
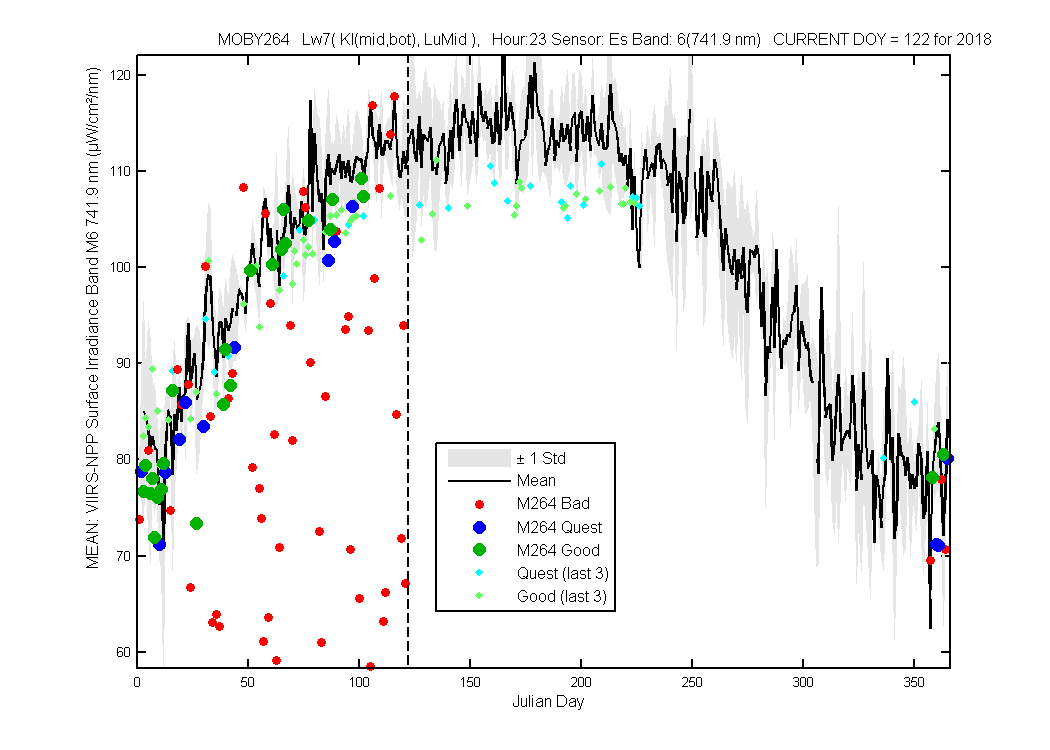
Figure 6
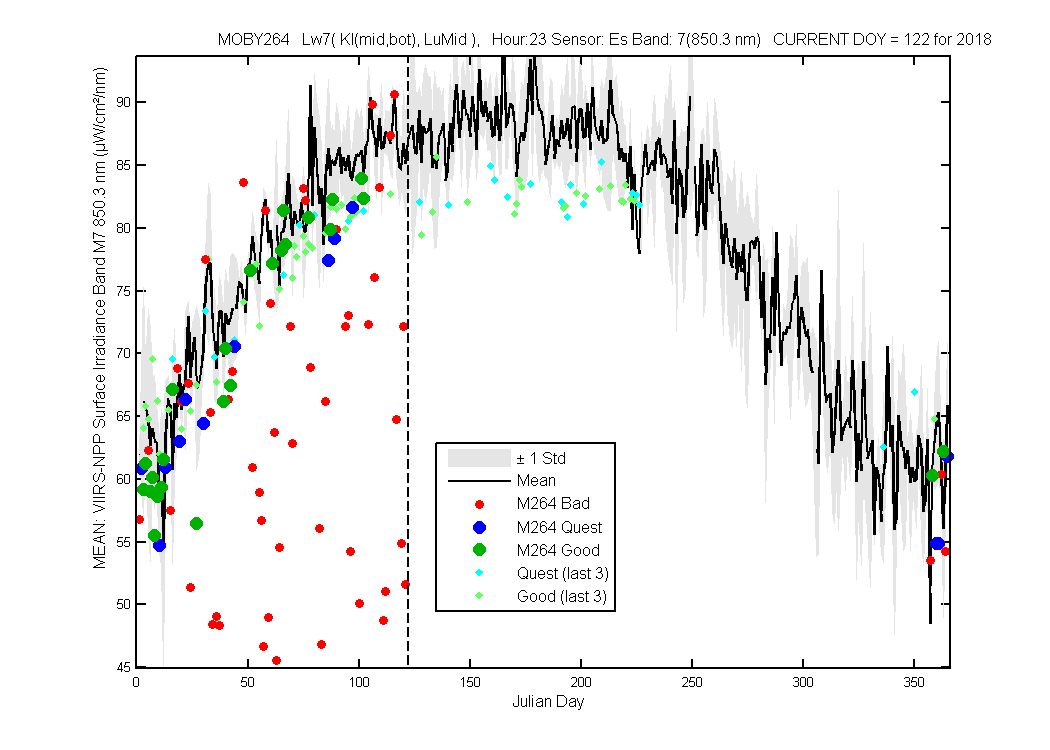
Figure 7
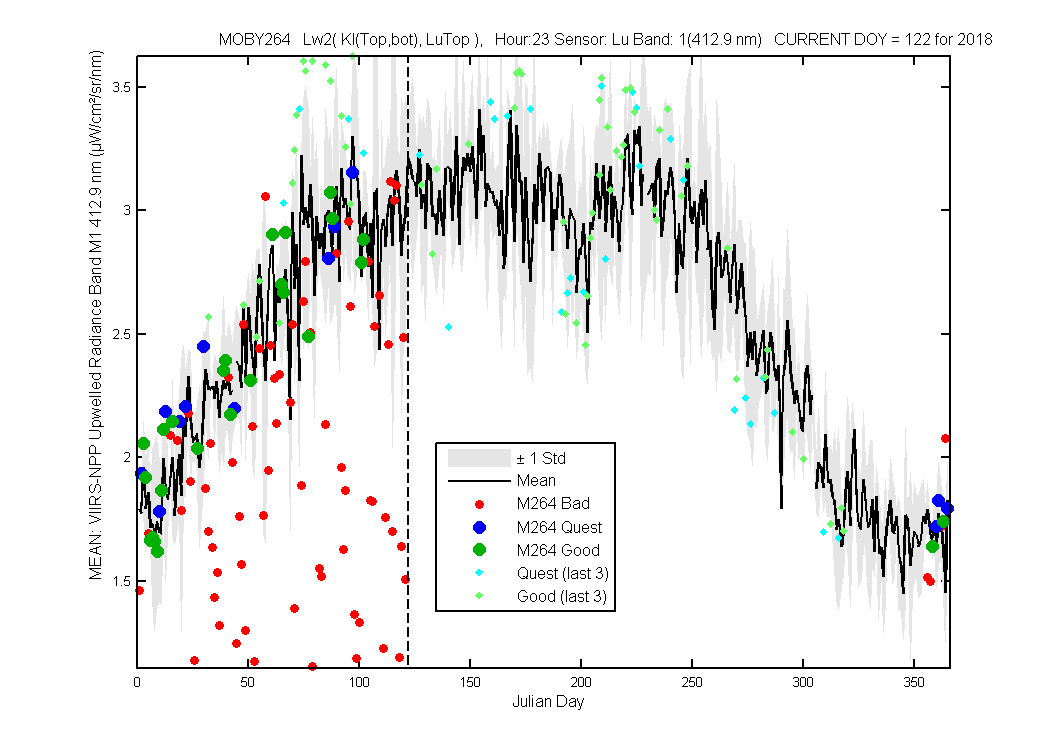
Figure 1
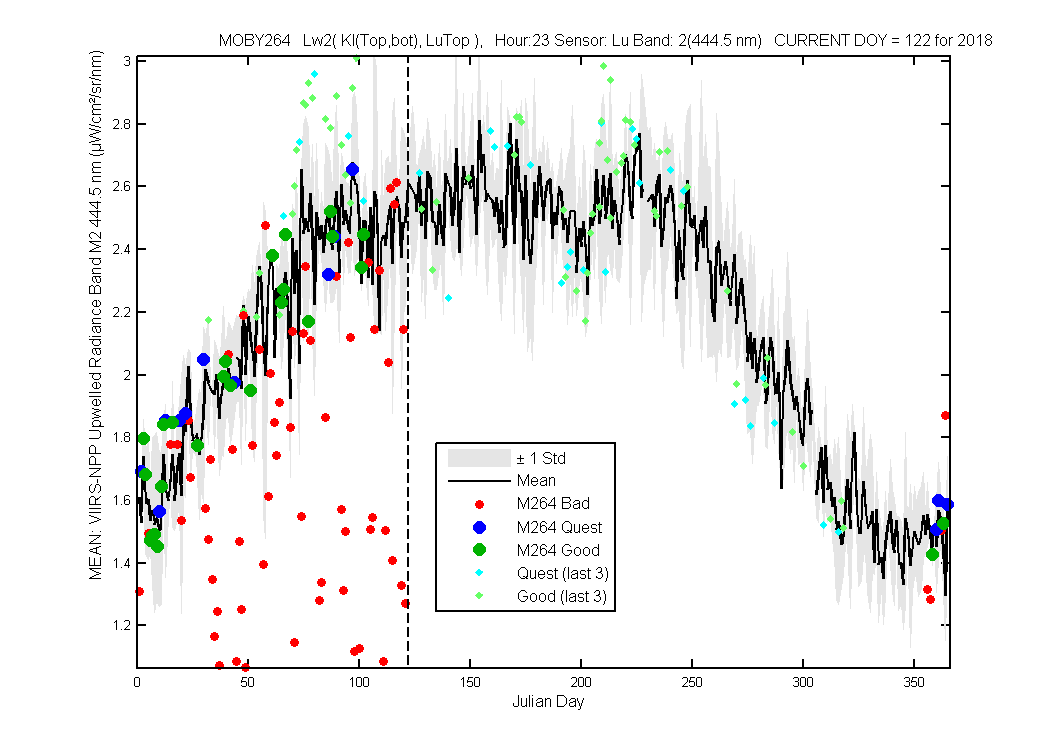
Figure 2
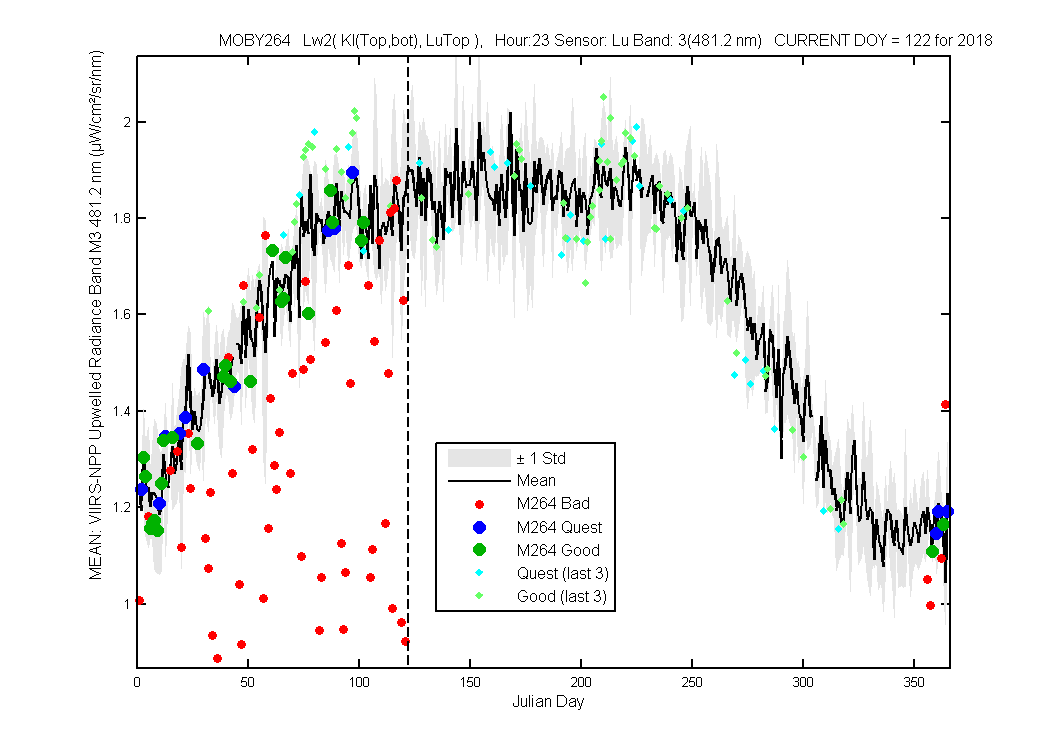
Figure 3
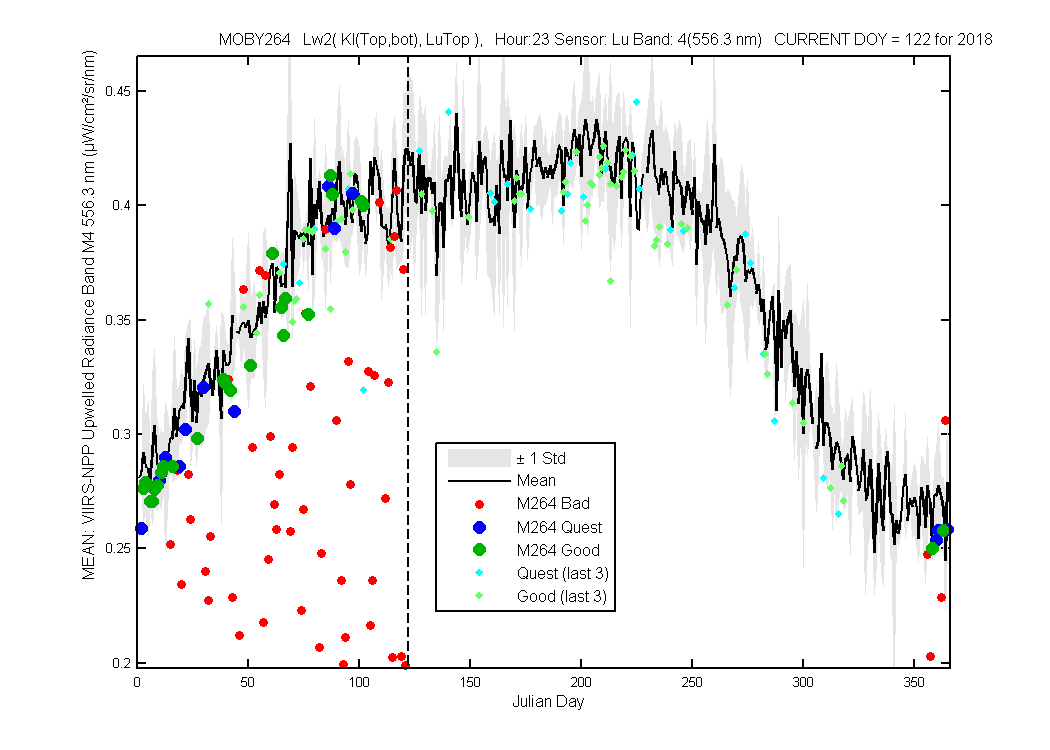
Figure 4
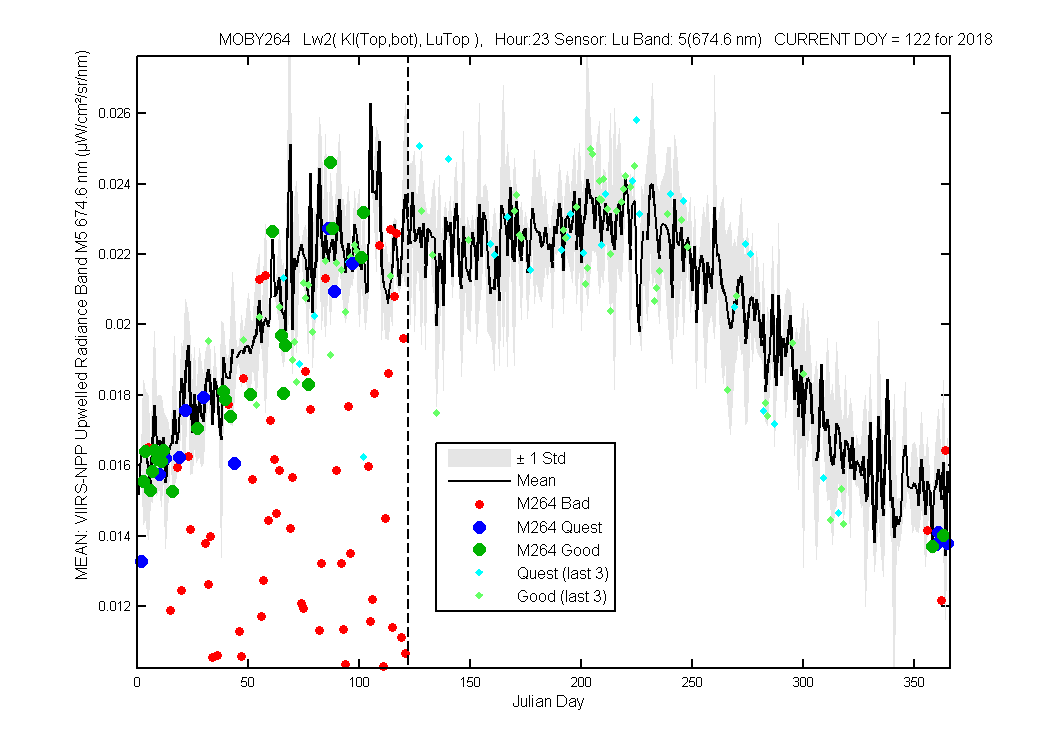
Figure 5

Figure 6
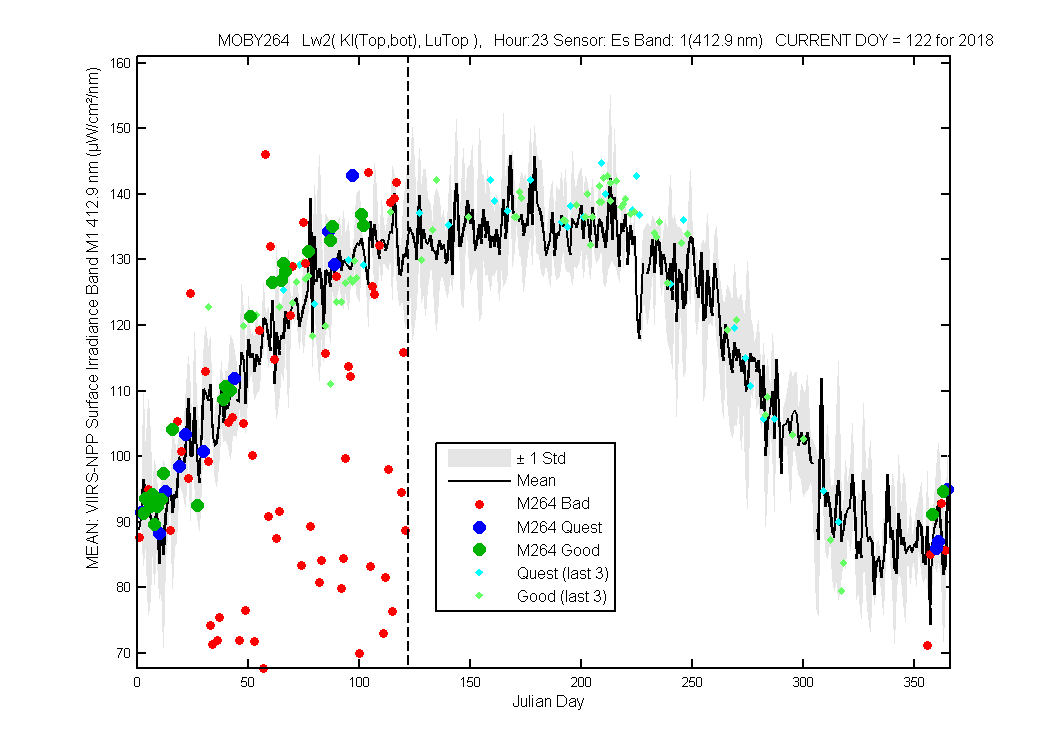
Figure 1
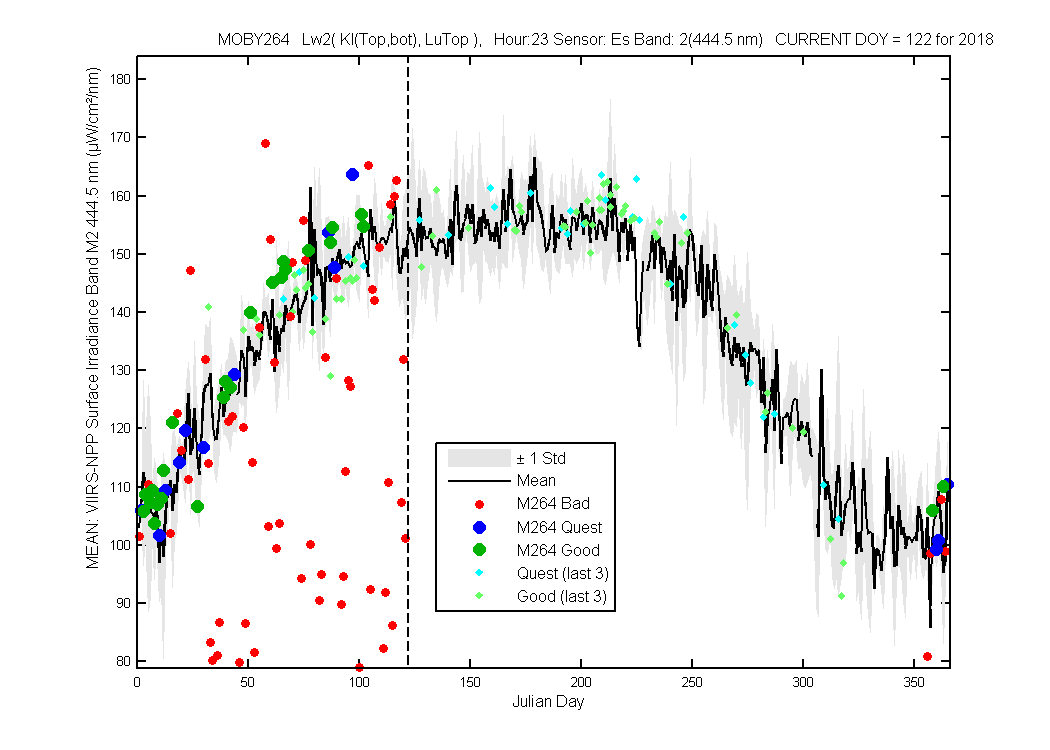
Figure 2
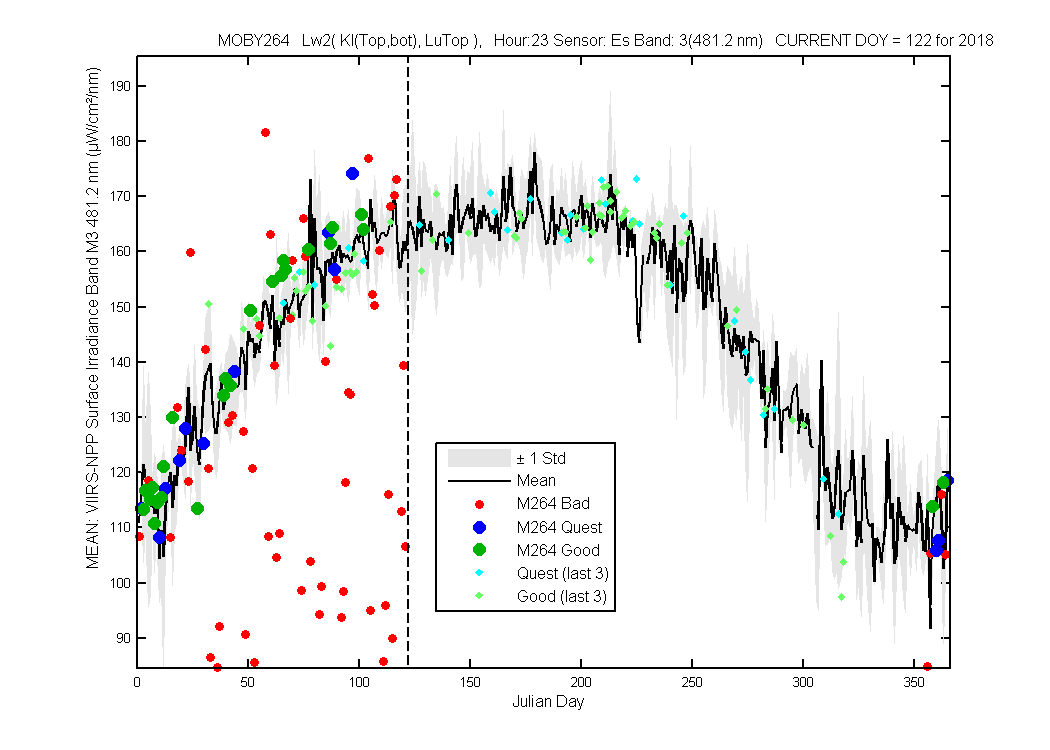
Figure 3
Figure 4
Figure 5
Figure 6
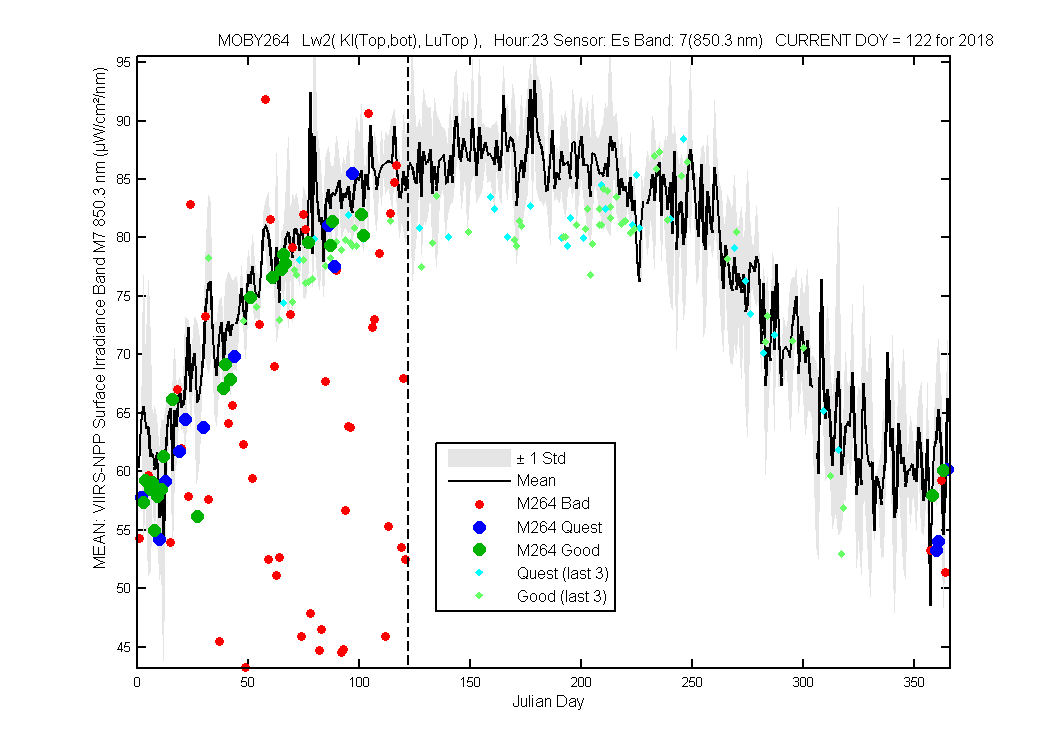
Figure 7
Ratio to correct the RSG sticky shutter for MOBY260
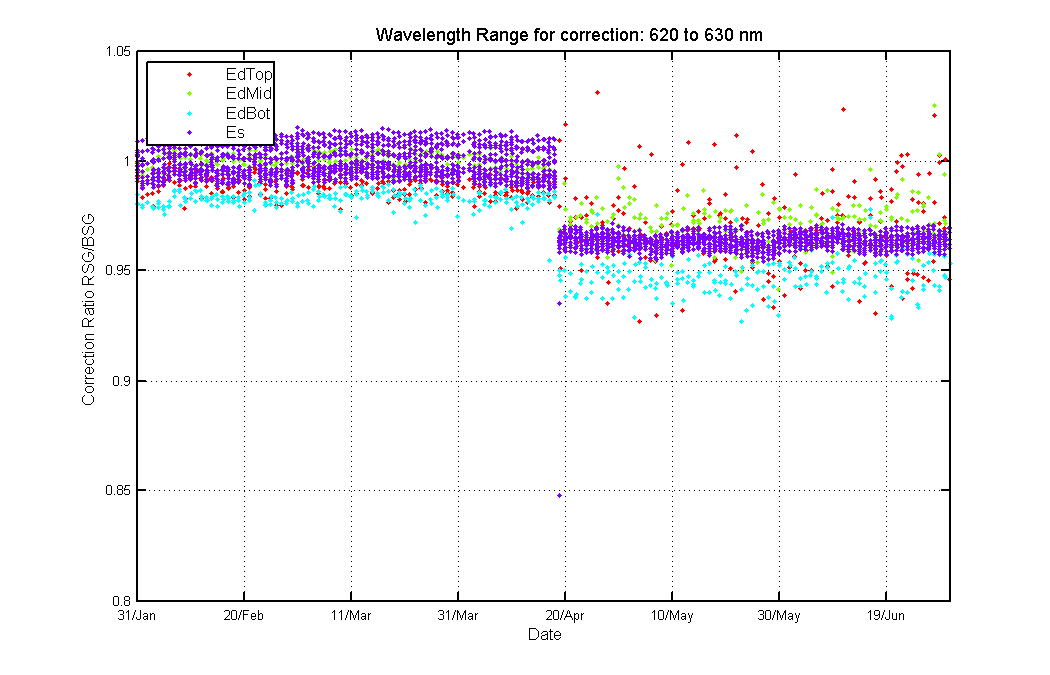
Figure 1B
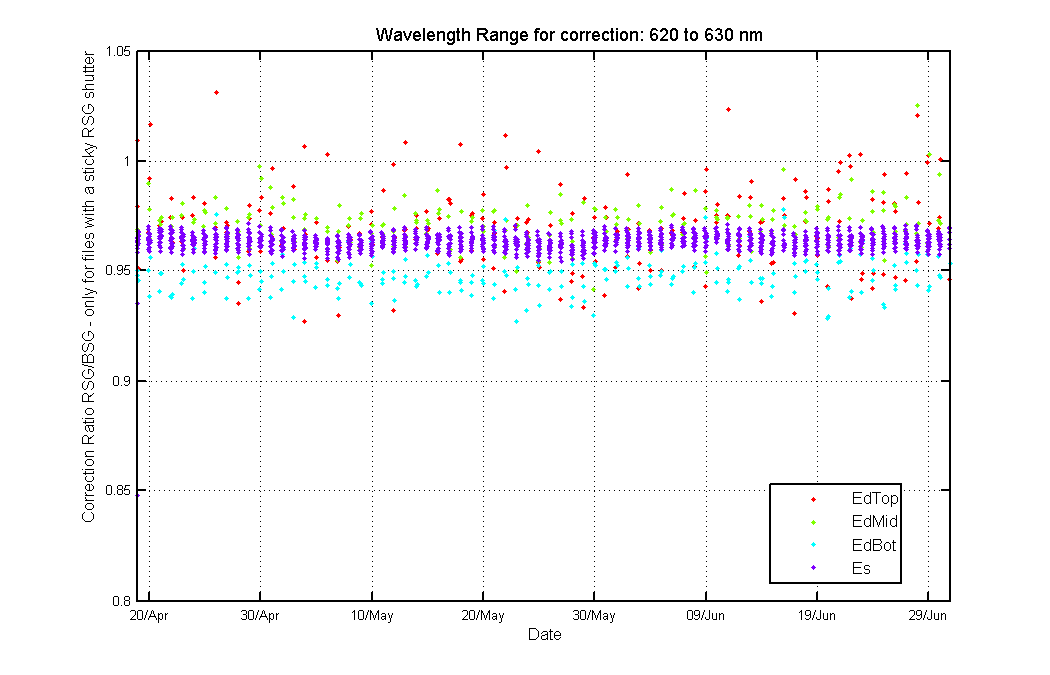
Figure 2B
Blue red offset graphs for the 4 deployments before the current deployment
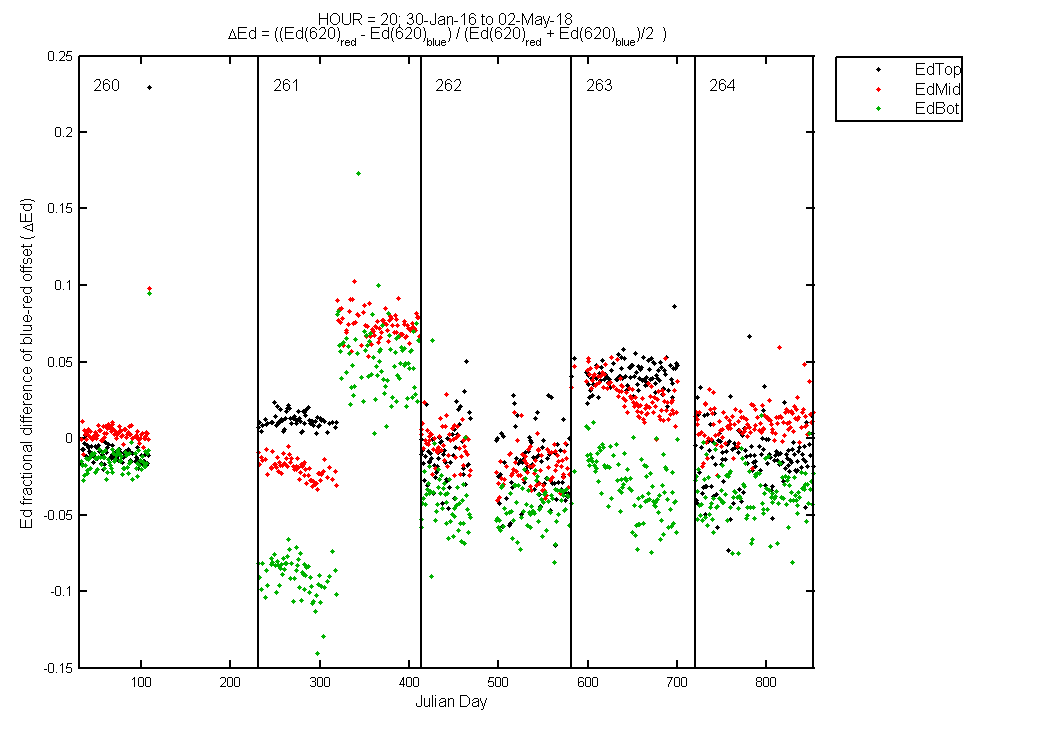
Figure 1B
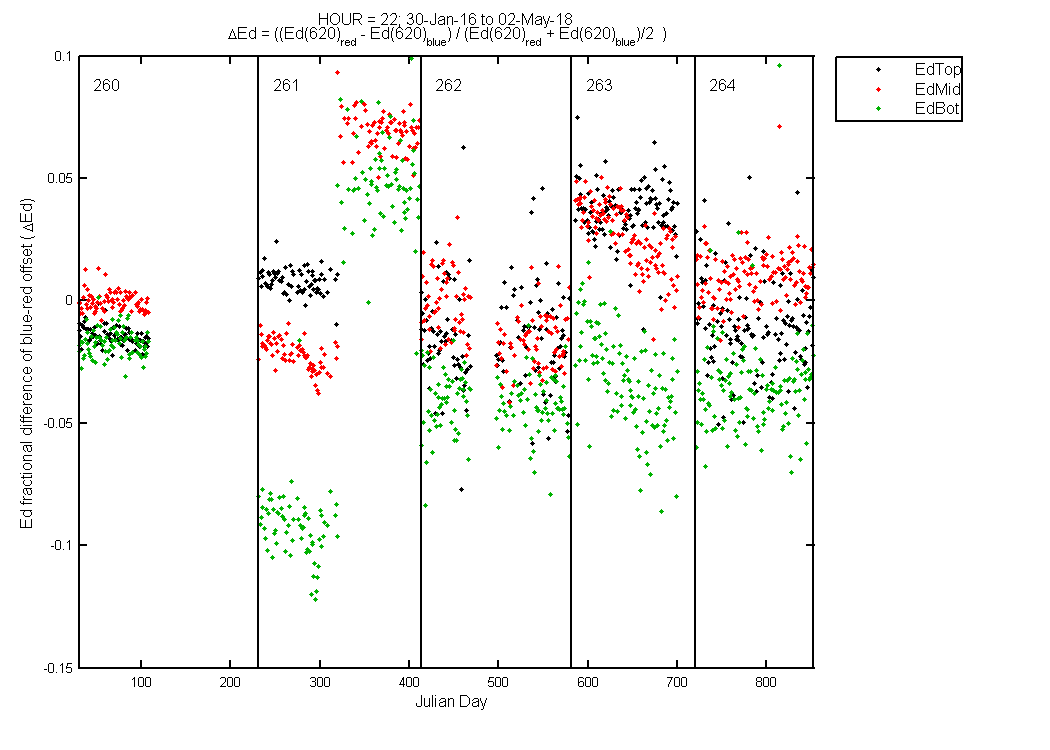
Figure 2B

Figure 3B
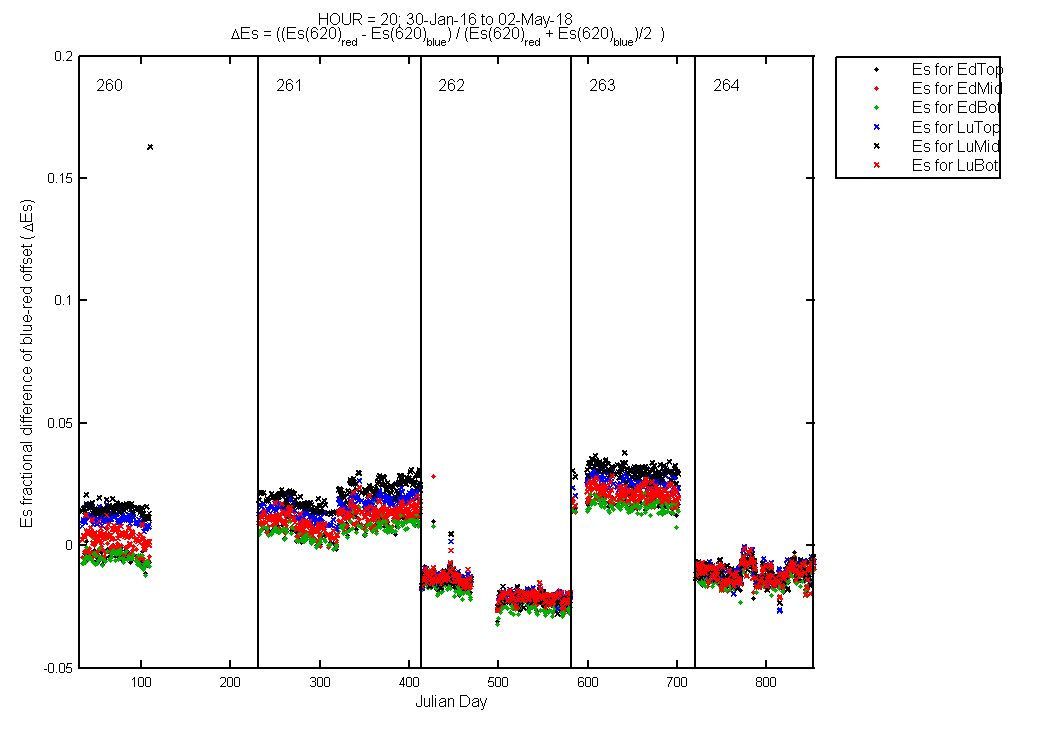
Figure 4B
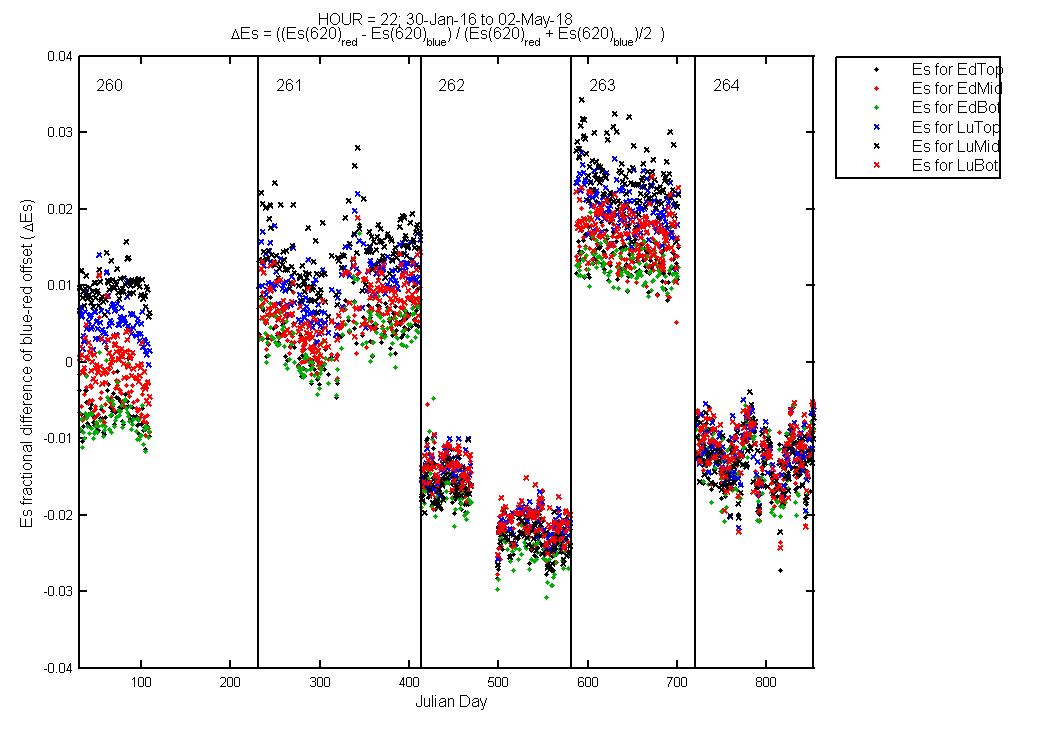
Figure 5B
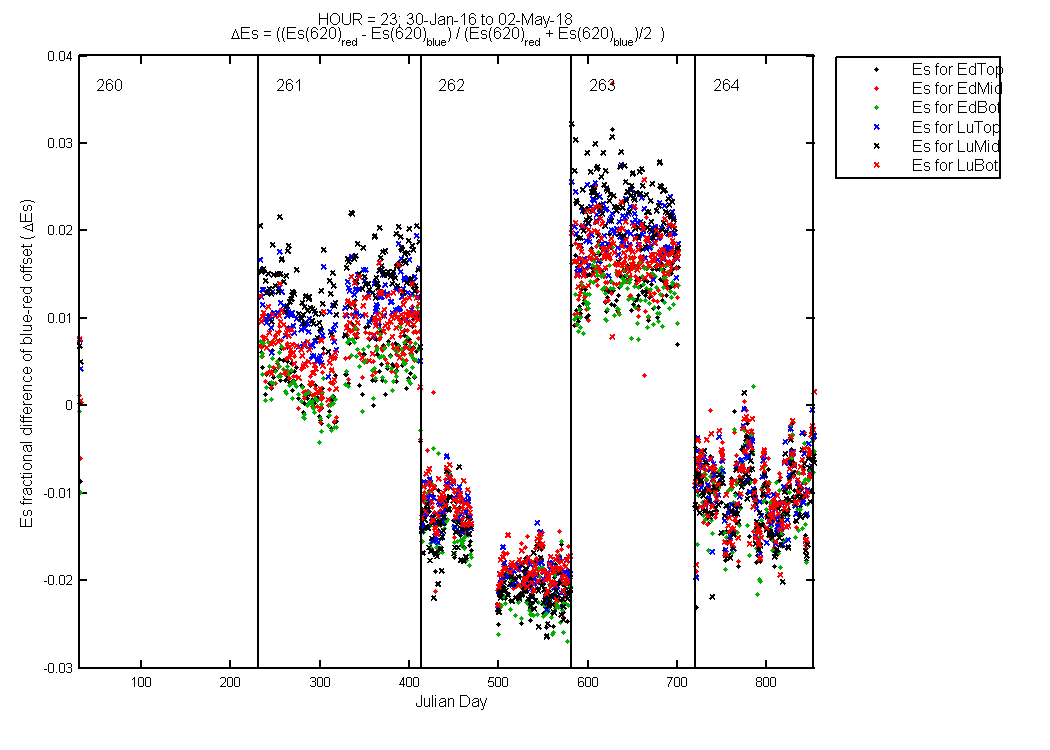
Figure 6B
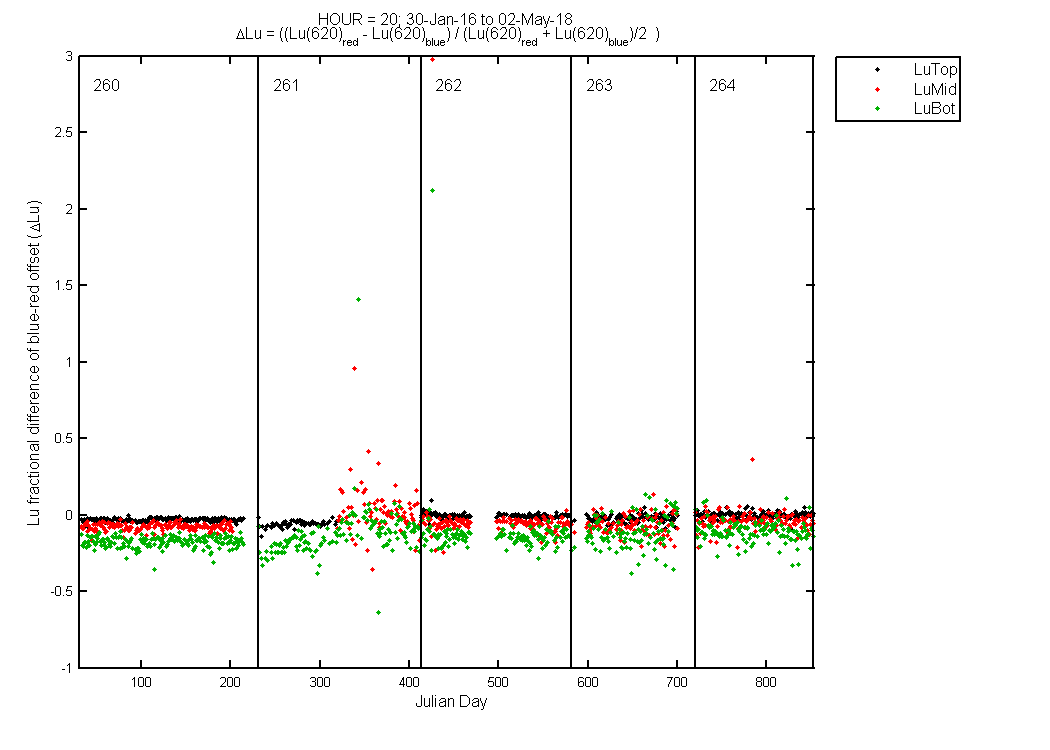
Figure 7B
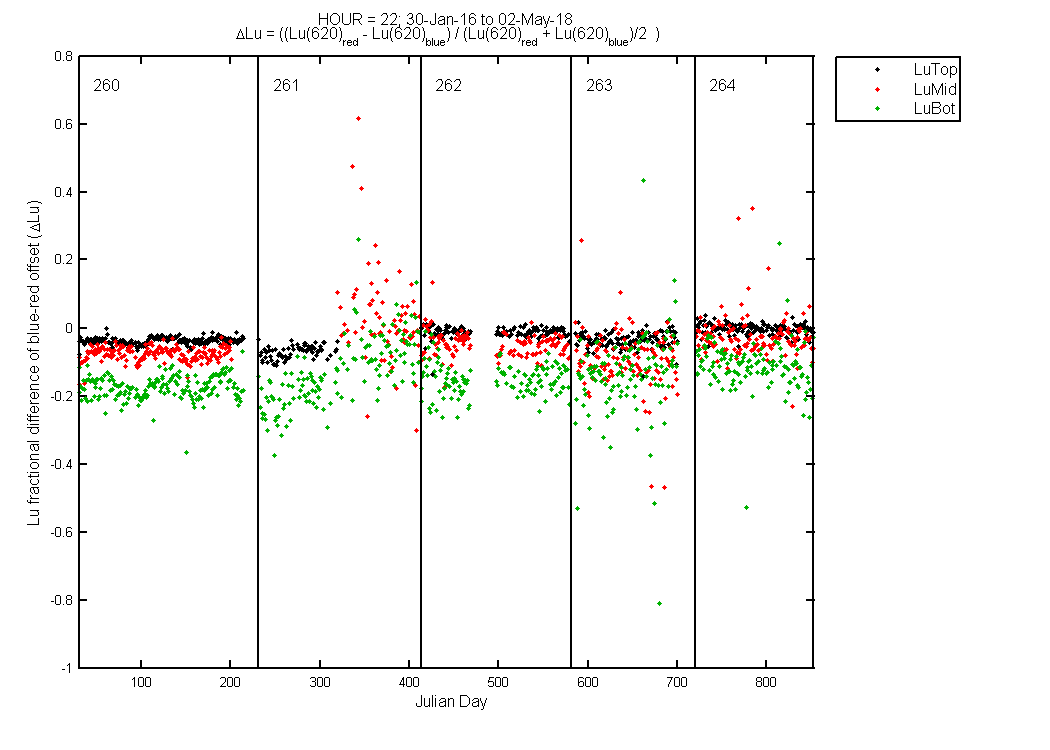
Figure 8B
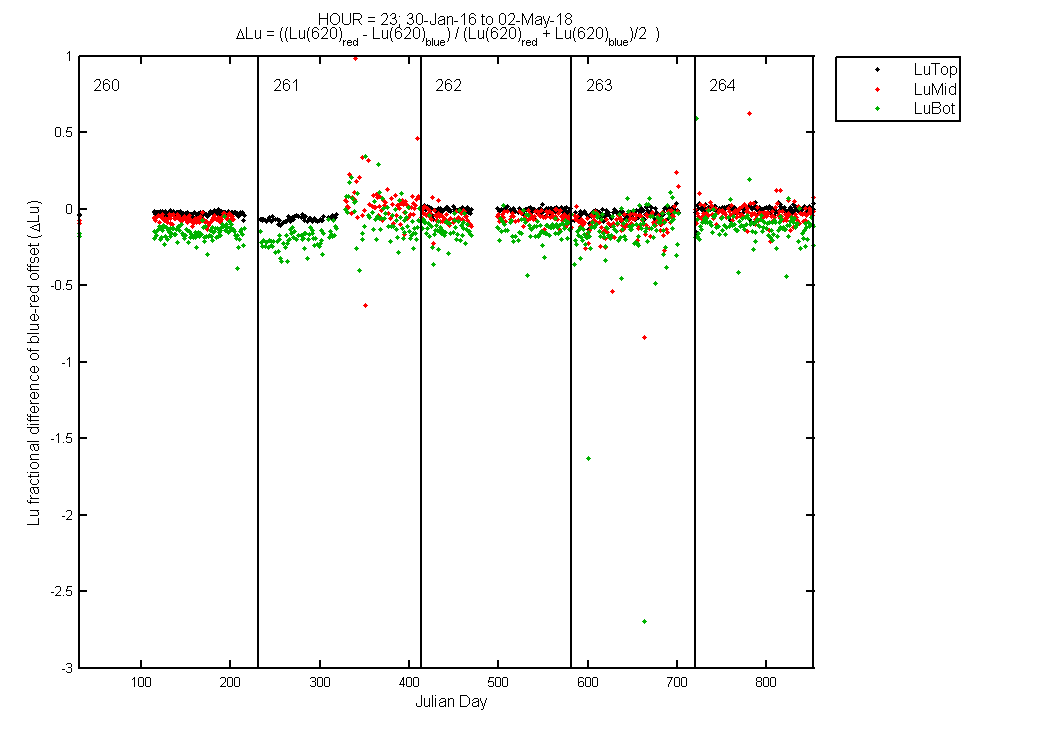
Figure 9B
REV date: 27-Aug-2018 11:21:09